Radford University
Is it Really a Small World After All?
Working in groups, learners research four countries' populations over the past 30 years. Using the data collected, the teams find regression equations that best fit the data. Taking the regression equations, they then make predictions...
Radford University
Animal Decline
Where did they all go? Small groups collect data on different animal species that are on a decline. Teams develop equations to model the populations over time and then create presentations about the decline of their animals. Classmates...
Radford University
Discovering Quadratics
Get to know quadratics from a couple of different perspectives. Classmates work in small groups to determine the optimal cooking time for microwave popcorn. Group members pop bags of popcorn for different times and collect data on the...
Radford University
Population Project
How fast does it grow? Scholars work on two tasks dealing with exponential growth, one on population growth and the second on investments. Learners research a country's population over the past century and make predictions of the current...
Radford University
Connecting Scatter Plots and Correlation Coefficients Activity
Collect a variety of bivariate data. Groups determine sets of data that would provide a positive, negative, and no correlation. Team members gather their data through out the week. Scholars plot the data and determine the relationship...
Radford University
Snappy Stair Sprints
Let's go for a run. Small groups determine a way to collect data to determine the time it would take to run a set of stairs. After creating a plan, teams collect data and graph their results, calculating the equation of best fit and...
Radford University
At the Gas Pump
Given the price of crude oil, gasoline, and diesel for the past several years, pupils plot the data to determine whether a correlation exists. Learners determine a regression line and predict the price of gasoline and diesel in the...
Radford University
Tuition Cost Activity
Can I afford to go to college? Small groups design a method to research college tuition for several years and make a prediction of costs in 2025. Classmates plot the the data on a scatter plot and graph the line of best fit to make their...
Radford University
Can I Create a Line/Curve of Best Fit to Model Water Drainage?
Learners collect data on the amount of water left in a bottle over time. They graph the data to determine whether the scatter plot shows a curved or straight relationship. Group members then determine an equation for the curve of best...
Radford University
Regression Analysis Activity
Don't let your knowledge of regression analysis regress. Pupils take part in three activities to learn about regression curves. They research and collect data to predict how long it will take a basketball to hit the ground, find a...
Radford University
Action Bungee Jump
Drop scatter plots onto the class. Teams collect data to determine how far an action figure will fall suspended by rubber bands. Using the collected data, groups determine a line of best fit. Given a drop height, they also determine the...
Radford University
Exploring Equations through Life Goals
What do I want to do when I grow up? Learners research job categories and determine a career within the category. Using the chosen job, pupils find the hourly wage and calculate future income based on percentage wages. Individuals then...
Radford University
Real World Data
Make math class feel more real by using real-world data. Scholars research or collect data on several different topics, such as nutrition, the motion of moving objects, cooling curves, and daylight hours. They create scatter plots using...
Radford University
Are You Faster than Bacteria?
Just how fast does bacteria grow? Over the course of three lessons, pupils investigate exponential growth with the use of bacteria growth. During the lesson, bacteria from a cell phone is grown to make a connection to real life. Using...
Radford University
Got Slope?
Go around and around with slope. The class investigates tornadoes by watching videos, building a homemade tornado, and performing research on the Storm Prediction Center website. Groups gather data and create scatter plots for twisters...
Radford University
Earthquake Problem
Shake up things in the classroom. The unit uses earthquakes to bring a real-life connection to finding arc lengths, logarithms, and equations of circles. Small groups determine whether particular towns would have felt an earthquake after...
Radford University
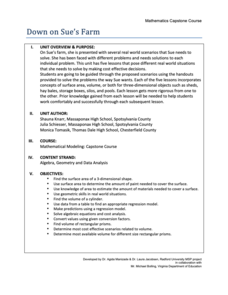
Down on Sue's Farm
When would a farmer use math? Class members work through five tasks on a farm that require knowledge of surface area, volume, and determining regression equations. The challenges range from figuring out the amount of paint to buy,...
Radford University
Environmental Issues
Pupils investigate the air pollution situation in China by fitting a curve to historical data. They dig deeper into environmental issues that are of interest and provide a mathematical analysis of the issue. Class members develop a route...
Radford University
Feeding the World
Using technology, pupils find an exponential function to model the population growth of the US. With more information, learners derive the population growth formula for the world. Ultimately, they determine the amount of protein needed...
Radford University
Corn and Popcorn
Have a popping good time. Using probability and statistics skills, learners determine which type of popcorn to buy based on the percentage of kernels popped. After analyzing corn and popcorn sales to make a prediction of future sales,...
Radford University
Danger! – An Analysis of the Death Toll of Natural Disasters
Decipher the danger of natural disasters. Using researched data, scholars work in groups to create data displays on the number of deaths from different types of natural disasters. They share their graphical representations with the class...
Radford University
Mathematical Modeling: Lessons 2-3
Not all functions are created equal. Pupils apply regression analysis using polynomial, exponential, and logarithmic functions to investigate the relationship between variables and to decide which function would be best to model the...
Radford University
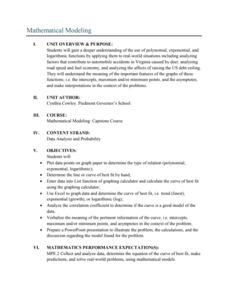
Mathematical Modeling: Lesson 1
Will more deer result in more big game licenses? Scholars first research data on the number of deer and the number of big game licenses in Virginia between 1990 to 2009. They apply polynomial, exponential, and logarithmic regression to...
Radford University
Pollution and Curves of Best Fit
Don't put the resource on curves of best fit out on the curb. Using researched data on trash and recycling, scholars create scatter plots and regression curves to analyze the information. As a culminating activity, they complete projects...


