Mabry MS Blog
Scatter Plots
Scatter plots are a fun way to gather and collect relevant data. The presentation goes through several examples and then describes the different types of correlation.
Wake Forest University
Authentic Activities for Connecting Mathematics to the Real World
Check out the handout from a presentation that contains a collection of high school algebra projects connecting a variety of mathematics to the real world. Activities range from simple probabilities to calculus. The activities...
National Research Center for Career and Technical Education
Health Science: Back to Basics
This lesson focuses on unit conversion, proportions, ratios, exponents, and the metric system. Discuss measurement with your math class and demonstrate how to solve several health-science word problems. Give learners a chance to visit an...
Curated OER
Application and Modeling of Standard Deviation
The first activity in this resource has learners computing the mean and standard deviation of two different data sets and drawing conclusions based on their results. The second activity has them using a dice-rolling simulation to...
Curated OER
Coffee and Crime
Is there a correlation between the number of coffee shops and the amount of crime in a given area? In this quick exercise, your class will examine the data, interpret the results, and discuss their conclusion. Concepts covered include...
Curated OER
Math TODAY - Breast Cancer Risks
Learners explore data that be modeled by a logistic function. They have the opportunity to study real-life data and create a mathematical function to model the data and make a prediction.
Curated OER
Strike a Pose: Modeling in the Real World (There's Nothing to It!)
Adjust this lesson to fit either beginning or more advanced learners. Build a scatter plot, determine appropriate model (linear, quadratic, exponential), and then extend to evaluate the model with residuals. This problem uses real-world...
Curated OER
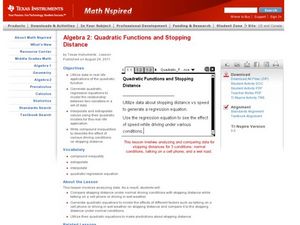
Quadratic Functions and Stopping Distance
Learners solve quadratic equations. In this algebra lesson, students factor and graph quadratic functions. they use the properties of quadratics to calculate the distance.
Curated OER
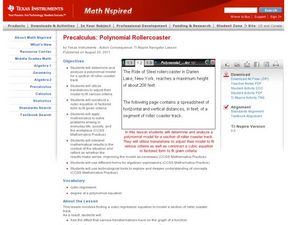
Polynomial Rollercoaster
Learners relate polynomials to a rollercoaster track as they translate a graph around on a coordinate plane. They differentiate between different forms of algebraic expressions.
Curated OER
Investigating Correlation
High schoolers investigate different types of correlation in this statistics instructional activity. They identify positive, negative and no correlation as it relates to their data. They then find the line of best fit for the...
Curated OER
Exploring Diameter and Circumference
Learn how to identify the diameter and circumference of a circle. Then, collect data on a circle and relate it to the diameter and circumference of a circle. Last, plot data and find the line of best fit.
Curated OER
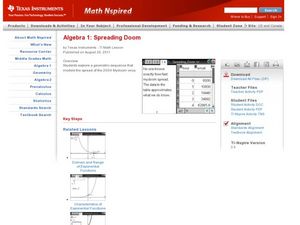
Spreading Doom
Students explore the pattern created by a sequence or series. In this geometry lesson, students relate the spread of a virus to the growth of exponential functions. They collect data as they analyze the sequence created by the growth.
Curated OER
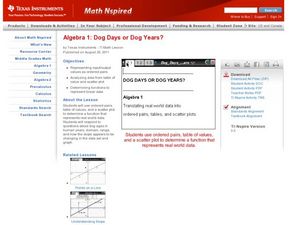
Dog Days or Dog Years?
In need of some algebraic fun with real world implications?Learners use ordered pairs, a table of values and a scatter plot to evaluate the validity of several real world data sets. The class focuses on dog ages in human...
Curated OER
The M & M Function
In this M & M instructional activity, students perform probability experiments. They collect and interpret data, identify the exponential function describing the data and create graphs from the collected information. This...
Curated OER
FCAT Real World Solving Linear Equations/Systems
Pupils relate real life situation to the equations, graphs and inequalities. They model real life scenarios using matrices and draw conclusions from their data. This lesson plan is aligned with FCAT.
Curated OER
Let's Gather Around the Circle
Scholars explore the relationship between circumference and diameter. Groups of learners measure the diameter and circumference of round objects and record their data on a given worksheet. They then input the data into their graphing...
Curated OER
To the Moon
Pupils explore circumference manipulating Moon Pie wrapper. In this geometry lesson, they manipulate snack wrappers to find circumference, diameter, radius and distance.
Curated OER
Carbon Dating
Simulate C-14 decay using M&M and Reese's Pieces candies. In this scatter-plot lesson, high schoolers perform an experiment to simulate the half life of C-14. Information is plotted on a scatter-plot. Students answer four...
Curated OER
Walk the Line
Learners create constant speed versus motion graphs. They will perform linear regressions on their data to describe the graphs mathematically.
Curated OER
Flipping Coins: Density as a Characteristic Property
Young scholars explore linear functions in a crime solving context. They collect and analyze data using linear equations, then interpret the slope and intercepts from a linear model.
Curated OER
Curve Fitting
Pupils investigate linear, quadratic, and exponential regressions. They plot sets of data points, determine the regression equation that best fits the data and lastly investigate the coefficient of determination.
Curated OER
TI-Nspire Activity: What Does Your Representation Tell You?
By learning to select the best representation for three meal plans, students compare three meal plans to determine the best choice. Data for the meal plans is sorted on a table, as an algebraic equation, and graphed on a coordinate grid....
Texas Instruments
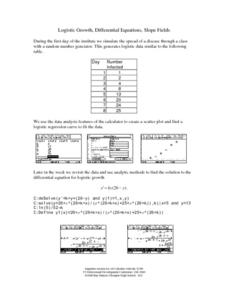
Logistic Growth, Differential Equations, Slope Fields
Investigate differential equations with your class. They use the TI-89 to explore differential equations analytically, graphically, and numerically as the examine the relationships between each of the three approaches.
Curated OER
TI-89 Activities for PreCalculus and AP Calculus
Using the TI-89 calculator, high schoolers explore the statistical, graphical and symbolic capabilities of the TI-89. Students investigate topics such as solving systems of equations, finding inverse functions, summations,...


