Flipped Math
Unit 5 Review: Bivariate Data
The data says it's a wrap. Pupils work through four review questions with multiple parts dealing with bivariate data. Questions cover creating and interpreting two-way tables and scatter plots with lines of best fit. Scholars finish up...
Teach Engineering
Powering a Device Using Food
Eat up a resource on using food to power electrical devices. Future engineers first experiment with different fruits and vegetables to determine the amount of electrical energy they provide. Based on the data, they design and create an...
Teach Engineering
Computer Simulation of an Artificial Neural Network
Ready to learn about machine learning? Pupils explore neutral networks and machine learning by analyzing the logic used in a single perceptron model. They consider its weaknesses and then use a multi-layer perceptron model to run...
Radford University
At the Gas Pump
Given the price of crude oil, gasoline, and diesel for the past several years, pupils plot the data to determine whether a correlation exists. Learners determine a regression line and predict the price of gasoline and diesel in the...
Rice University
Introductory Statistics
Statistically speaking, the content covers several grades. Featuring all of the statistics typically covered in a college-level Statistics course, the expansive content spans from sixth grade on up to high school. Material comes from a...
College Board
2002 AP® Statistics Free-Response Questions Form B
Develop a deeper understanding of statistics. The six released free-response items from the 2002 AP® Statistics Form B involve several concepts that are currently in the regular statistics standards. Teachers see how AP® assessed the...
College Board
2004 AP® Statistics Free-Response Questions Form B
Over the years, data analysis has been important. Looking back to the 2004 AP® Statistics Form B free-response questions, pupils and teachers see the importance of analysis of data sets. The six questions contain analysis of data on...
College Board
1999 AP® Statistics Free-Response Questions
Closer to 2010 than expected. Several of the 1999 AP® Statistics free-response questions align to Common Core standards. Items ask pupils to analyze residuals, two-way tables, and calculate expected values to determine the fairness of a...
PHET
Least-Squares Regression
Less is best when looking at residuals. Scholars use an interactive to informally fit a linear regression line to data on a scatter plot. The interactive provides a correct best fit line with residuals and correlation coefficient to...
Kenan Fellows
How Does an Unhealthy Diet Influence our Health and Well-Being?
You are what you eat, or so they say! After surveying family and friends on a week of eating habits, learners analyze the data for patterns. They compare different variables such as fats and cost, fats and calories, or fats and LDLs.
Kenan Fellows
Climate Change Impacts
Turn up the heat! Young mathematicians develop models to represent different climates and collect temperature data. They analyze the data with regression and residual applications. Using that information, they make conclusions about...
Kenan Fellows
Let's Move
Find a statistical reason for a fresh start. Using a hypothetical scenario, individuals research statistical data of three different cities. Their goal? Find the best statistical reason for a business to move to a new location. Their...
Kenan Fellows
Applying Linear Regression to Marathon Data
It's not a sprint, it's a marathon! Statistic concepts take time to develop and understand. A guided activity provides an opportunity for individuals to practice their linear regression techniques in spreadsheet software. The activity...
101 Questions
Blocks
Block play can teach children about gravity, physics, and spatial relationships. A hands-on lesson incorporates these concepts with an activity in which learners examine the relationship between levels in a pile. Scholars begin to...
101 Questions
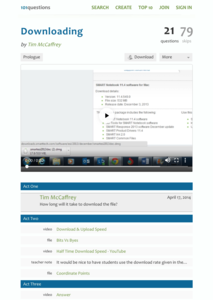
Downloading
Have you ever wanted to download a great lesson, but you weren't sure if you had enough time? Scholars learn to create a function for this situation to determine when a file will finish downloading. They also learn the difference between...
101 Questions
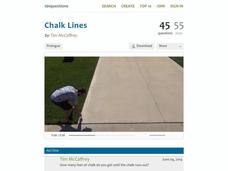
Chalk Lines
Read between the lines to find a solution. Budding mathematicians analyze a situation to solve a problem. They view a video presentation of the problem, brainstorm important information to gather, and write linear equations to find...
Shodor Education Foundation
Regression
How good is the fit? Using an interactive, classmates create a scatter plot of bivariate data and fit their own lines of best fit. The applet allows pupils to display the regression line along with the correlation coefficient. As a final...
CK-12 Foundation
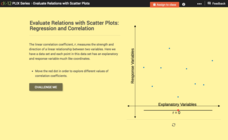
Evaluate Relations with Scatter Plots: Regression and Correlation
Introduce the concept of a correlation coefficient using an interactive lesson. Learners begin by manipulating a correlation coefficient and watching a graph change to represent the new value. Questions help strengthen their...
National Council of Teachers of Mathematics
Geogebra: Residuals and Linear Regression
If the line fits, use it. Using a Geogebra interactive, pupils plot points and try to find the best fit line. They assess the linear fit by analyzing residuals. A radio button allows participants to show the regression line and the...
CK-12 Foundation
Fitting Lines to Data
Scatter the TV sales over weeks. Pupils create a scatter plot to display the number of TV sales over a period of several weeks. The interactive allows class members to create two lines of best fit. Then they determine which line fits...
Mathematics Vision Project
Modeling Data
Is there a better way to display data to analyze it? Pupils represent data in a variety of ways using number lines, coordinate graphs, and tables. They determine that certain displays work with different types of data and use two-way...
Santa Monica College
The Density of Liquids and Solids
There are underwater rivers that flow on the ocean floor thanks to a difference in density. Scholars learn about the density in both liquids and solids in the second lesson of an 11-part series. They then determine the density of water,...
Noyce Foundation
Through the Grapevine
Teach statistics by analyzing raisins. A thorough activity provides lesson resources for five levels to include all grades. Younger pupils work on counting and estimation, mid-level learners build on their understanding of the measures...
Inside Mathematics
Population
Population density, it is not all that it is plotted to be. Pupils analyze a scatter plot of population versus area for some of the states in the US. The class members respond to eight questions about the graph, specific points and...


