Math Planet
Math Planet: Algebra 1: Writing Linear Equations Using the Slope Intercept Form
Explains what the slope-intercept form is and how to find the equation of a line given two points on it. Includes modeled video lesson. [3:32]
CK-12 Foundation
Ck 12: Geometry: Lines in the Coordinate Plane Study Guide
This study guide on lines in a coordinate plane covers key terms, what different line slopes look like, postulates about parallel and perpendicular lines, the slope-intercept equation, how to graph parallel and perpendicular lines, and...
Thinkport Education
Thinkport: Algebra Ii: Regression
Build on your understanding of modeling with linear, quadratic and exponential functions to begin to include other function families.
Thinkport Education
Thinkport: Algebra Ii: Linear, Quadratic and Exponential Regression
Review linear regression and analyze how well this model fits the data. You will also be introduced to residuals and the correlation coefficient, and use these tools to determine whether or not a linear model is the best fit for a set of...
Shodor Education Foundation
Shodor Interactivate: Multiple Linear Regression
Students compare multiple independent variables as predictors of one dependent variable. Students explore correlation and lines of best-fit.
Shodor Education Foundation
Shodor Interactivate: Slope Slider
This activity allows the user to explore the relationship between slope and intercept in the Cartesian coordinate system.
Shodor Education Foundation
Shodor Interactivate: Linear Regression and Correlation
Learners are introduced to correlation between two variables and the line of best fit.
Khan Academy
Khan Academy: Writing Linear Functions Word Problems
Practice writing a linear function that represents a real-world relationship that is given verbally. Functions are written using function notation.
CK-12 Foundation
Ck 12: Algebra: Determining the Equation of a Line
Write the equations of lines in point-slope form and in slope-intercept form and graph linear equations.
Other
Nearpod: Slope Intercept Form
In this lesson on slope-intercept form, students will learn how to write and graph a linear function using the slope-intercept form by learning about the y-intercept and slope.
Shodor Education Foundation
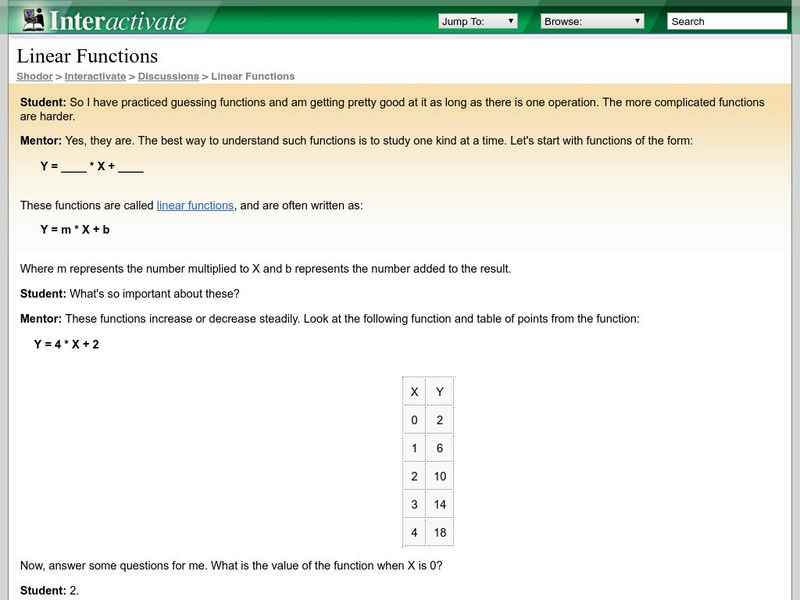
Shodor Interactivate: Linear Functions
This website introduces the concept of linear functions in slope intercept form.
Other
Technical Tutoring: Linear Functions and Straight Lines
Learn how to write equations for linear functions in all three forms: point-slope, slope-intercept, and general. Also look at equations for parallel and perpendicular. The page gives an explanation of how to obtain the point slope form...
Math Graphs
Houghton Mifflin: Math Graphs: Fitting Models to Scatter Plots 1 [Pdf]
Students use a scatter plot to determine whether data can be modeled by a linear function, a quadratic function, a trigonometric function, or that there appears to be no relationship between x and y. The resource consists of an enlarged...
Math Graphs
Houghton Mifflin: Math Graphs: Fitting Models to Scatter Plots 2 [Pdf]
Students use a scatter plot to determine whether data can be modeled by a linear function, a quadratic function, a trigonometric function, or that there appears to be no relationship between x and y. The resource consists of an enlarged...
Math Graphs
Houghton Mifflin: Math Graphs: Fitting Models to Scatter Plots 3 [Pdf]
Students use a scatter plot to determine whether data can be modeled by a linear function, a quadratic function, a trigonometric function, or that there appears to be no relationship between x and y. The resource consists of an enlarged...
Math Graphs
Houghton Mifflin: Math Graphs: Fitting Models to Scatter Plots 4 [Pdf]
Students use a scatter plot to determine whether data can be modeled by a linear function, a quadratic function, a trigonometric function, or that there appears to be no relationship between x and y. The resource consists of an enlarged...
Math Graphs
Houghton Mifflin: Math Graphs: Line of Best Fit 9 [Pdf]
The practice problem has learners sketch a line of best fit, create a linear model, and compare both lines on a calculator. The given points are available in PDF format.
Math Graphs
Houghton Mifflin: Math Graphs: Line of Best Fit 10 [Pdf]
The practice problem has learners sketch a line of best fit, create a linear model, and compare both lines on a calculator. The given points are available in PDF format.
Math Graphs
Houghton Mifflin: Math Graphs: Line of Best Fit 11 [Pdf]
Students sketch a line of best fit, create a linear model, and compare both lines on a calculator. The given points are available in PDF format.
Math Graphs
Houghton Mifflin: Math Graphs: Line of Best Fit 12 [Pdf]
Students sketch a line of best fit, create a linear model, and compare both lines on a calculator. The given points are available in PDF format.
Math Graphs
Houghton Mifflin: Math Graphs: Line of Best Fit 13 [Pdf]
Students investigate the line of best fit and the regression feature of a graphing calculator. The example consists of a math graph with given points that are available in PDF format.
Math Graphs
Houghton Mifflin: Math Graphs: Line of Best Fit 14 [Pdf]
Students investigate the line of best fit and the regression feature of a graphing calculator. The example consists of a math graph with given points that are available in PDF format.
Math Graphs
Houghton Mifflin: Math Graphs: Line of Best Fit 15 [Pdf]
The practice problem explores the validity of the line of best fit and a linear regression model created on a graphing calculator. The given points are available in PDF format.
Math Graphs
Houghton Mifflin: Math Graphs: Line of Best Fit 16 [Pdf]
The practice problem explores the validity of the line of best fit and a linear regression model created on a graphing calculator. The given points are available in PDF format.


