Math Graphs
Houghton Mifflin: Math Graphs: Line of Best Fit 17 [Pdf]
Students calculate a linear regression model using a graphing calculator. The given points are available in PDF format.
Math Graphs
Houghton Mifflin: Math Graphs: Line of Best Fit 18 [Pdf]
Students calculate a linear regression model using a graphing calculator. The given points are available in PDF format.
Math Graphs
Houghton Mifflin: Math Graphs: Estimating Slope 8 [Pdf]
Students calculate the slope of a straight line from its graph. The handout is available in PDF format.
Math Graphs
Houghton Mifflin: Math Graphs: Estimating Slope 9 [Pdf]
Students calculate the slope of a straight line from its graph. The handout is available in PDF format.
Math Graphs
Houghton Mifflin: Math Graphs: Estimating Slope 10 [Pdf]
Learners determine how much one variable changes in relation to the change of another variable. The math graph is available in PDF format.
Math Graphs
Houghton Mifflin: Math Graphs: Estimating Slope 11 [Pdf]
Learners determine how much one variable changes in relation to the change of another variable. The math graph is available in PDF format.
Math Graphs
Houghton Mifflin: Math Graphs: Fitting Models to Scatter Plots 5 [Pdf]
Students evaluate a scatter plot to determine the relationship between two variables. The scatter plot is available in PDF format.
Math Graphs
Houghton Mifflin: Math Graphs: Fitting Models to Scatter Plots 6 [Pdf]
Students evaluate a scatter plot to determine the relationship between two variables. The scatter plot is available in PDF format.
Math Graphs
Houghton Mifflin: Math Graphs: Fitting Models to Scatter Plots 7 [Pdf]
Learners use a given scatter plot to identify whether the data can be modeled by a linear, quadratic, or trigonometric function. The math graph is available in PDF format.
Math Graphs
Houghton Mifflin: Math Graphs: Fitting Models to Scatter Plots 8 [Pdf]
Learners use a scatter plot to identify whether the data can be modeled by a linear, quadratic, or trigonometric function. The math graph is available in PDF format.
ClassFlow
Class Flow: Slope Intercept Form
[Free Registration/Login Required] This flipchart should be used to help the students understand the concept of slope-intercept form and expand their knowledge of graphing linear equations.
ClassFlow
Class Flow: Straight Lines
[Free Registration/Login Required] Students explore straight lines, graphing lines and applying the formula for graphing linear equations.
Wyzant
Wyzant: Determining Slope From a Graph
Learners determine the slope of each line. The resource consists of an example, practice exercises, and solutions.
ClassFlow
Class Flow: Writing Linear Equations
[Free Registration/Login Required] Students will be able to write an equation of a line given a point and a slope. Students write the equation of a line given appropriate information such as slope, x-intercept, y-intercept, two points,...
ClassFlow
Class Flow: Definition of Slope
[Free Registration/Login Required] Presents the definition of slope and the formulas for y-intercept form.
ClassFlow
Class Flow: Linear Models
[Free Registration/Login Required] Students will learn the different forms of an equation of a line and will find the equations of a line in all three forms- point-slope form, slope-intercept form, and the general form (Ax+By=C).
Varsity Tutors
Varsity Tutors: Hotmath: Slope Intercept Form
Find a quick, concise explanation of the slope-intercept form. An example is given and clearly explained.
Purple Math
Purplemath: Scatterplots and Regressions
Explains the purpose of scatterplots, and demonstrates how to draw them.
Doina Popovici
Math Play: Slope Intercept Basketball Game
This online game includes slope-intercept problems for students to solve. Students must recognize which variables represent the slope, or rise-over-run, and the y-intercept.
Interactive Mathematics
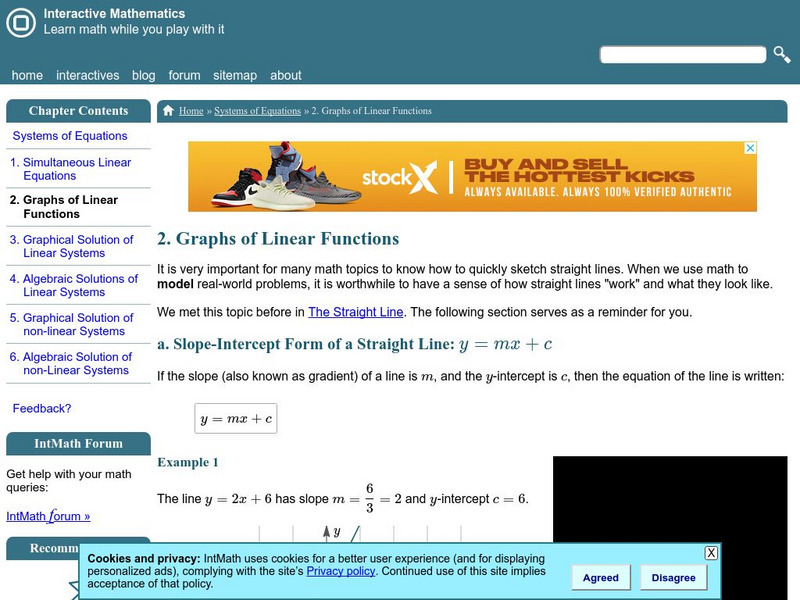
Interactive Mathematics: Graphs of Linear Functions
A brief overview of three methods used to graph lines is presented through examples. Slope-intercept, point-slope, and intercept form are demonstrated step-by-step along with a review of the formula for finding the slope of a line.
J Coffman
Joseph Coffman's Lecture Notes: Linear Equations
Introduction to linear equations with examples as well as graphing and slope-determination methods.
Curated OER
Linear Functions
This site contains a short tutorial on point-slope, slope-intercept, and general form of linear equations. The site has an interactive graph of lines showing how the graph of a line changes when values of the linear equation change.


![Houghton Mifflin: Math Graphs: Line of Best Fit 17 [Pdf] Unknown Type Houghton Mifflin: Math Graphs: Line of Best Fit 17 [Pdf] Unknown Type](https://d15y2dacu3jp90.cloudfront.net/images/attachment_defaults/resource/large/FPO-knovation.png)


