Texas Instruments
Texas Instruments: Identifying Types of Correlation From a Graph and Calculator
Students will identify different types of correlations graphically and by using the linear regression analysis obtained from a TI-84 Plus calculator. Students will also obtain and know the significance of a correlation coefficient as a...
Texas Instruments
Texas Instruments: Using Regression Functions
For this activity, learners experiment with regression features of the calculator to find a best fit for a data set.
Wolfram Research
Wolfram Math World: Correlation Coefficient
This is an elaborate site pertaining to the Correlation coefficient. The site begins with a brief introduction to what the correlation coefficient represents then goes into detail on how to find this value. The site has many links and...
Wolfram Research
Wolfram Math World: Correlation Coefficient
MathWorld offers a technical, yet informative, explanation of the correlation coefficient for bivariate normal distribution.
Texas Instruments
Texas Instruments: Bivariate Data
This set contains statistics questions regarding bivariate data: scatter plots, the least-squares regression line, and their interpretation. The student is asked about the meaning of the various strengths and directions of linear...
Texas Instruments
Texas Instruments: Fitting an Equation to Bivariate Data
In this activity, students fit a linear least-square regression line to population data. They explore various functions to model the given data.
Texas Instruments
Texas Instruments: Exploring Bivariate Data
Students graph scatter plots and understand the concepts of correlation and least-squares regression. They also perform transformations to achieve linearity in the data plot.
Texas Instruments
Texas Instruments: Inferences of the Least Squares Regression
This set contains questions regarding inference for the slope of the least-squares linear regression line. The student learns to develop hypotheses, find the test statistic, and reach a conclusion in the context of the original problem.
Khan Academy
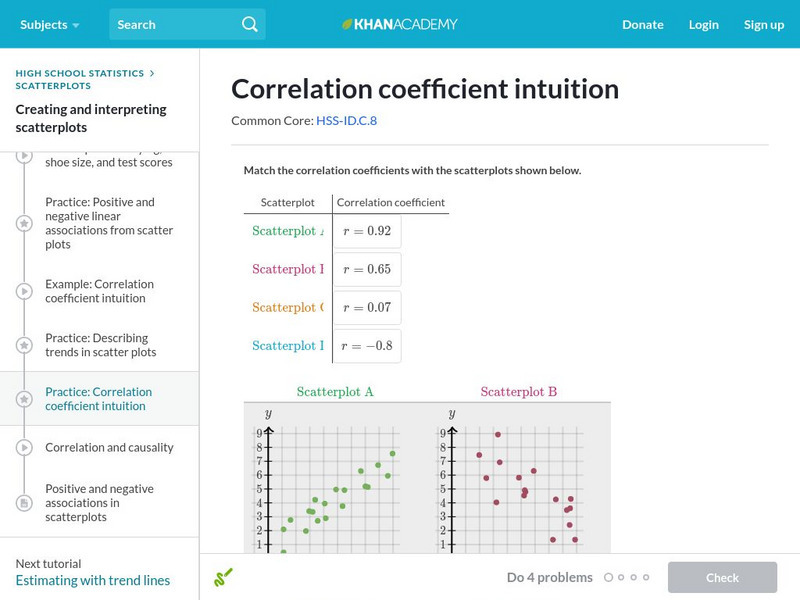
Khan Academy: Correlation Coefficient Intuition
Match correlation coefficients to scatterplots to build a deeper intuition behind correlation coefficients. Students receive immediate feedback and have the opportunity to try questions repeatedly, watch a video or receive hints.
Illustrative Mathematics
Illustrative Mathematics: S Id Coffee and Crime
This task addresses many standards regarding the description and analysis of bivariate quantitative data, including regression and correlation. Given a scatter plot, students will answer a variety of questions about linear relationships,...
CK-12 Foundation
Ck 12: Statistics: Least Squares Regression
[Free Registration/Login may be required to access all resource tools.] This Concept introduces students to least-squares regression.
CK-12 Foundation
Ck 12: Statistics: Linear Regression Equations
[Free Registration/Login may be required to access all resource tools.] Use a calculator to create a scatter plot and to determine the equation of the line of best fit.
Thinkport Education
Thinkport: Algebra Ii: Regression
Build on your understanding of modeling with linear, quadratic and exponential functions to begin to include other function families.
Thinkport Education
Thinkport: Algebra Ii: Linear, Quadratic and Exponential Regression
Review linear regression and analyze how well this model fits the data. You will also be introduced to residuals and the correlation coefficient, and use these tools to determine whether or not a linear model is the best fit for a set of...
National Council of Teachers of Mathematics
Nctm: Illuminations: Line of Best Fit
Use this activity to practice how to enter a set of data, plot the data on a coordinate grid, and determine the equation for a line of best fit.
Shodor Education Foundation
Shodor Interactivate: Multiple Linear Regression
Students compare multiple independent variables as predictors of one dependent variable. Students explore correlation and lines of best-fit.
Shodor Education Foundation
Shodor Interactivate: Regression
Plot a bivariate data set, determine the line of best fit for their data, and then check the accuracy of your line of best fit.
Shodor Education Foundation
Shodor Interactivate: Linear Regression and Correlation
Learners are introduced to correlation between two variables and the line of best fit.
Khan Academy
Khan Academy: Correlation Coefficient Review
The correlation coefficient r measures the direction and strength of a linear relationship. Calculating r is pretty complex, so we usually rely on technology for the computations. We focus on understanding what r says about a scatterplot.
Quia
Ixl Learning: Correlation
Brush up on your math skills relating to correlation then try some practice problems to test your understanding.
Wolfram Research
Wolfram Math World: Spearman Rank Correlation Coefficient
This page gives a description of the Spearman Rank Correlation Coefficient, which is an approximation to the exact correlation coefficient, r. It is somewhat easier to compute than the exact correlation coefficient. Also provides links...
National Council of Teachers of Mathematics
The Math Forum: Ask Dr. Math: What Is a Regression Line?
This page is an answer to an email question that someone wrote in and it explains what a regression line is.
Other
Introduction to Simple Linear Regression
This introduction to simple linear regression includes graphs and a discussion of extrapolation and interpolation.
Math Graphs
Houghton Mifflin: Math Graphs: Line of Best Fit 1 [Pdf]
The practice problem examines the line of best fit and scatter plots. The scatter plot is available in PDF format.


