ClassFlow
Class Flow: Graphing Inequalities
[Free Registration/Login Required] Students represent functional relationships using tables, equations, and graphs, and describe the connection among these representations.
Shmoop University
Shmoop: Basic Statistics & Probability: Scatter Plots & Correlation
The statistics resource explores scatter plots and correlation. Students learn about the concepts through notes and detailed examples. The resource consists of practice exercises to check for comprehension of the topics.
Varsity Tutors
Varsity Tutors: Hotmath: Algebra Review: Scatter Plots
Find a quick, concise explanation of what a scatter plot is. Several examples are given and clearly explained.
National Council of Teachers of Mathematics
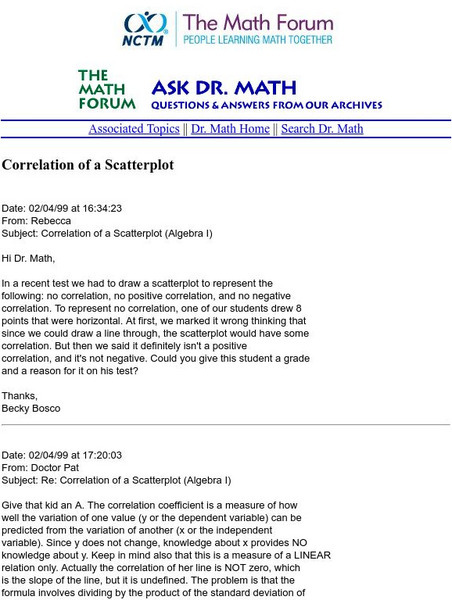
The Math Forum: Nctm: Ask Dr. Math: Correlation of a Scatterplot
This page from Ask Dr. Math describes the correlation of a scatterplot and gives an example of one with no correlation.
University of Glasgow
University of Glasgow: Steps Statistics Glossary: Correlation Coefficient
Overview of correlation coefficient, or a number between 1 and -1 which measures the degree to which two variables are linearly related. It is followed by a description of the Pearson product moment correlation coefficient.
University of Glasgow
Steps: Pearson's Product Moment Correlation Coefficient
Overview of Pearson's Product Moment Correlation Coefficient, which is just one example of a correlation coefficient.
Purple Math
Purplemath: Scatterplots and Regressions
Explains the purpose of scatterplots, and demonstrates how to draw them.
CK-12 Foundation
Ck 12: Plix Series: Correlation and Causation
[Free Registration/Login Required] Sort a list of events into a Venn diagram with the categories Causation and Correlation, then answer a challenge question.
Wolfram Research
Wolfram Math World: Linear Regression Model
A basic definition for what linear regression is can be found here. Examples of forms of linear regression are also given.
Rice University
Hyper Stat Online Statistics Textbook: Correlation
This resource gives a definition of correlation and an example using a fire and fire fighters.


