CK-12 Foundation
Stratified Random Sampling: An Extracurricular Study
Learning isn't a random process. A well-designed interactive lesson helps classes make key conclusions about stratified random sampling. They calculate group percentages and use those percentages to decide on sampling totals.
Mathematics Vision Project
Module 8: Statistics
What does it mean to be normal in the world of statistics? Pupils first explore the meaning of a normal distribution in the eight-lesson module. They then apply the statistics related to normal distributions such as mean, standard...
Teach Engineering
Processes on Complex Networks
Introduces your class to random processes in networks with an activity that uses information about disease spread using the susceptible, infectious, resistant (SIR) model. Participants determine whether a susceptible person becomes...
EngageNY
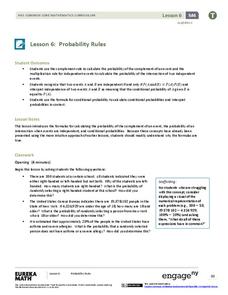
Probability Rules (part 1)
In statistics, probability rules—literally! Learners use their previous knowledge and explore a set of rules for conditional probability, independent probability, and complements. Given different scenarios, they must determine what type...
EngageNY
Events and Venn Diagrams
Time for statistics and learning to overlap! Learners examine Venn Diagrams as a means to organize data. They then use the diagrams to calculate simple and compound probabilities.
National Research Center for Career and Technical Education
Business Management and Administration: Compound Interest - A Millionaire's Best Friend
Many math concepts are covered through this resource: percentages, decimals, ratios, exponential functions, graphing, rounding, order of operations, estimation, and solving equations. Colorful worksheets and a link to a Google search for...
National Research Center for Career and Technical Education
Architecture and Construction: Stair Construction
Within the context of the construction industry, algebra pros begin to calculate slope from the sizes of stair steps. This is a terrific lesson, especially for aspiring engineers. Just be aware that it might be a stretch to meet all of...
National Research Center for Career and Technical Education
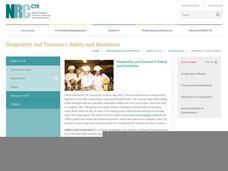
Hospitality and Tourism 1: Safety and Sanitation
Math and science come alive in this career-related instructional activity on sanitation. Along the way, learners explore bacterial growth rates using exponential notation and graphs. A link to a very brief, but vivid video shows just how...
Illustrative Mathematics
Block Scheduling
If a random sample determines that 45% of students favor block scheduling, is it possible that the actual percentage might be 50% or 60%? In this task, learners use data from a computer-generated simulation to determine the plausibility...
Google
Surveys and Estimating Large Quantities
Looking for an estimation activity a bit more involved than the typical "guess the number of jellybeans in the jar" game? Here, learners use a picture to estimate the number of people at a large event, look for potential problems with...
Google
The Law of Large Numbers and Probability
Learners investigate why theoretical probability doesn't always match reality. The activity involves using Python 2.7 (or Sage) to set up a Bernoulli Trial. It also involves setting up a spreadsheet to simulate the Birthday Paradox....
National Research Center for Career and Technical Education
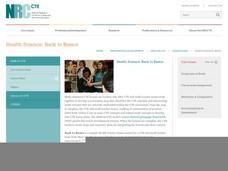
Health Science: Back to Basics
This lesson focuses on unit conversion, proportions, ratios, exponents, and the metric system. Discuss measurement with your math class and demonstrate how to solve several health-science word problems. Give learners a chance to visit an...
Illustrative Mathematics
Sarah, the chimpanzee
Is Sarah, the chimpanzee, smart or just a lucky guesser? Here, learners set up a simulation and read a dotplot to find out the likelihood of getting 7 out of 8 questions correct. One suggested modification would be to have your class...
Texas Instruments
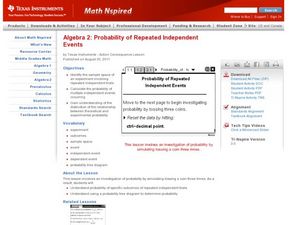
Probability of Repeated Independent Events
Statisticians analyze different samples to find independent and dependent events. In this probability lesson, pupils predict the outcome and then calculate the real outcome. They create a tree diagram to help predict the probability of...
Rice University
Hyper Stat Online Statistics Textbook: Trend Analysis
A series of pages that help us understand testing one or more components of a trend using specific comparisons, a set of coefficients, error analysis of variance and the probability value.
American Association of Physics Teachers
Com Padre Digital Library: Open Source Physics: Binomial Distribution Model
This downloadable mathematics java simulation explores the binomial probability distribution model. The probability and number of trials can be changed to see the effect on the distribution model.
American Association of Physics Teachers
Com Padre Digital Library: Open Source Physics: Uniform Spherical Distribution
The java simulation demonstrates methods for picking a random point on a sphere. Both the incorrect method of a uniform random distribution as well as the correct weighted distribution are shown.
Missouri State University
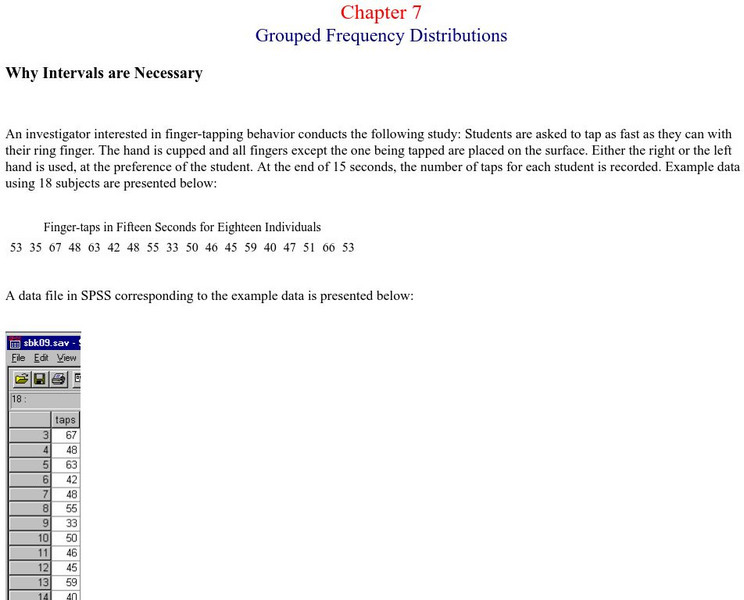
Missouri State Univ.: Introductory Statistics: Grouped Frequency Distributions
An example is provided for the explanation of grouped frequency distributions. Graphs show how to construct histograms and overlapping bell curves, and Excel documents are discussed as being useful here.
Missouri State University
Missouri State University: Introductory Statistics: The Sampling Distribution
A review is provided at the start of this resource, then the more specific discussion of sampling distributions gets under way. Graphs are provided for ease in understanding the material.
Science Education Resource Center at Carleton College
Serc: Reese's Pieces Activity: Sampling From a Population
Students use Reese's Pieces to investigate the proportion of orange candies present in a set of 25. After collecting data for the class, they use a web applet to collect more data for random samples. This is compared to the actual...
Google
Google for Education: Application and Modeling of Standard Deviation
Young scholars examine graphs of data using each of the measures of central tendency to determine when to use each in order to get a true overview of the data.
Vision Learning
Visionlearning: Statistics: Introduction to Inferential Statistics
An introduction to inferential statistics to find relationships and patterns in datasets.
Other
American Statistical Association: Using Dice to Introduce Sampling Distributions
In this lesson, students use a dice simulation to investigate how random sampling affects the properties of the distribution of a sample proportion, and are introduced to the sampling distribution of the sample proportion.
Texas Education Agency
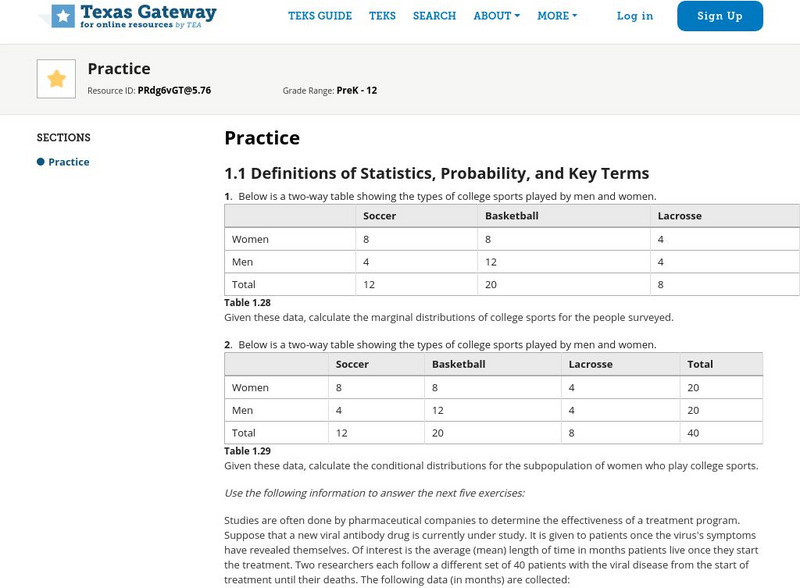
Texas Gateway: Tea Statistics: Sampling and Data: Practice
A set of exercises where students must analyze statistcal data and methodology and answer questions about distributions, sampling, results, accuracy, frequency, experimental design, and ethical practices.


