Rice University
Introductory Statistics
Statistically speaking, the content covers several grades. Featuring all of the statistics typically covered in a college-level Statistics course, the expansive content spans from sixth grade on up to high school. Material comes from a...
College Board
2003 AP® Statistics Free-Response Questions Form B
Update the statistics in your course using older AP® questions. The 2003 AP® Statistics free-response questions cover several of the concepts in the current statistics standards for all pupils. Items contain questions about determining...
College Board
1999 AP® Statistics Free-Response Questions
Closer to 2010 than expected. Several of the 1999 AP® Statistics free-response questions align to Common Core standards. Items ask pupils to analyze residuals, two-way tables, and calculate expected values to determine the fairness of a...
College Board
2008 AP® Statistics Free-Response Questions
Is your knowledge of statistics at an AP® level? Scholars try out the 2008 AP® Statistics free-response questions. The questions cover box plots, scatter plots, distributions, probability distributions, experiments, statistical tests,...
College Board
2009 AP® Statistics Free-Response Questions Form B
Is your class taking the AP® Statistics exam in the near future? You may want to take a look here. Using the 2009 AP® Statistics free-response questions Form B helps learners become familiar with the testing conditions, such as time...
College Board
2009 AP® Statistics Free-Response Questions
Preparing for a high-stakes test can be highly nerve-wracking, but understanding the test content and format helps ease the anxiety. The 2009 AP® Statistics free-response questions are available for reference. Several topics under...
College Board
2010 AP® Statistics Free-Response Questions Form B
Form a good familiarity with the AP® test using Form B of the 2010 AP® Statistics free-response questions. Pupils use a test from a previous administration to prepare for their exams. A set of six questions assesses box plots,...
College Board
2010 AP® Statistics Free-Response Questions
Familiarity with the AP® exam is highly beneficial for test-takers. Scholars use the 2010 AP® Statistics free-response questions familiarize themselves with the test content and format. Studies and experiments, linear regression,...
College Board
2011 AP® Statistics Free-Response Questions Form B
Is the sequel better than the original? The 2011 AP® Statistics free-response questions, Form B, is available for instructors to reference. Among the topics covered in the exam are histograms, distributions, studies and experiments,...
College Board
2011 AP® Statistics Free-Response Questions
Familiarize yourself with the AP® exam by looking at past tests. A PDF file provides the 2011 AP® Statistics free-response questions. The questions include topics such as mean, standard deviation, conditional probability, sampling...
College Board
2012 AP® Statistics Free-Response Questions
There's no better way to prepare your class for the AP® test format than previous exams. Instructors and scholars use the 2012 AP® Statistics free-response questions to familiarize themselves with the test. Topics covered in the exam...
College Board
2013 AP® Statistics Free-Response Questions
AP® exams don't need to be shrouded in mystery. The 2013 AP® Statistics free-response questions are available for instructors to reference. It includes questions on mean, standard deviation, normal distribution, confidence intervals,...
Howard Hughes Medical Institute
Population Genetics, Selection, and Evolution
The Hardy-Weinberg principle states that alleles and genotypes remain constant in the absence of evolutionary influences. Scholars complete a simple hands-on activity applying the Hardy-Weinberg principle to sample data. They observe how...
Mathed Up!
Questionnaires
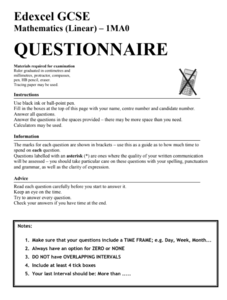
Check the appropriate box. Class members determine whether a questionnaire is an appropriate one. The portion of the General Certificate of Secondary Education math assessment review requires pupils to create a valid questionnaire to...
Howard Hughes Medical Institute
Beaks as Tools: Selective Advantage in Changing Environments
How does nature select some adaptations over others? Scholars experiment picking up seeds with two different types of tools simulating beaks. After practicing, they experience a drought where one type of seed suddenly isn't available....
Howard Hughes Medical Institute
Evolution in Action: Data Analysis
An environmental factor, such as a drought, sometimes speeds up the rate of natural selection. Scholars analyze data on the beaks of birds around the time of the drought. They compare those that survived to those that perished and find...
101 Questions
Representative Sample
At what point does data switch from being an outlier to part of the average? Scholars view conflicting news articles about protesters. They must decide which, if any, side is using the correct sample to draw their conclusions. It's a...
Shodor Education Foundation
Spinner
Go round and round to compare theoretical and experimental probabilities. Learners set the number of sectors and the number of spins for a spinner. Then, a table displays the experimental and theoretical probabilities of the spinner for...
Shodor Education Foundation
Ordered Simple Plot
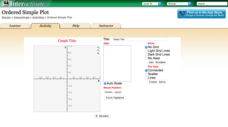
Open your imagination to make algebra-inspired creations. An interactive lesson has scholars graph images from a set of parameters. Users can practice minimum values, maximum values, and scale as well as key features.
Radford University
A Change in the Weather
Explore the power of mathematics through this two-week statistics unit. Pupils learn about several climate-related issues and complete surveys that communicate their perceptions. They graph both univariate and bivariate data and use...
Statistics Education Web
It’s Elemental! Sampling from the Periodic Table
How random is random? Demonstrate the different random sampling methods using a hands-on activity. Pupils use various sampling techniques to choose a random sample of elements from the periodic table. They use the different samples to...
Statistics Education Web
Sampling in Archaeology
Compare different random sampling types using an archaeological setting. Scholars collect data from an archaeological plot using simple random samples, stratified random samples, systematic random samples, and cluster random samples....
American Statistical Association
Chocolicious
To understand how biased data is misleading, learners analyze survey data and graphical representations. They use that information to design their own plans to collect information on consumer thoughts about Chocolicious cereal.
Mathematics Vision Project
Module 8: Statistics
What does it mean to be normal in the world of statistics? Pupils first explore the meaning of a normal distribution in the eight-lesson module. They then apply the statistics related to normal distributions such as mean, standard...


