Cuemath
Cuemath: Measures of Central Tendency
A comprehensive guide for learning all about measures of central tendency with definitions of mean, median, and mode, solved examples, and practice questions.
University of Regina (Canada)
University of Regina: Math Central: Central Tendency Activity
An Internet activity that creates data to be evaluated using statistics skills such as central tendency, data analysis, and graphing. The topic of the exercise is the average height of a student's class.
Texas Instruments
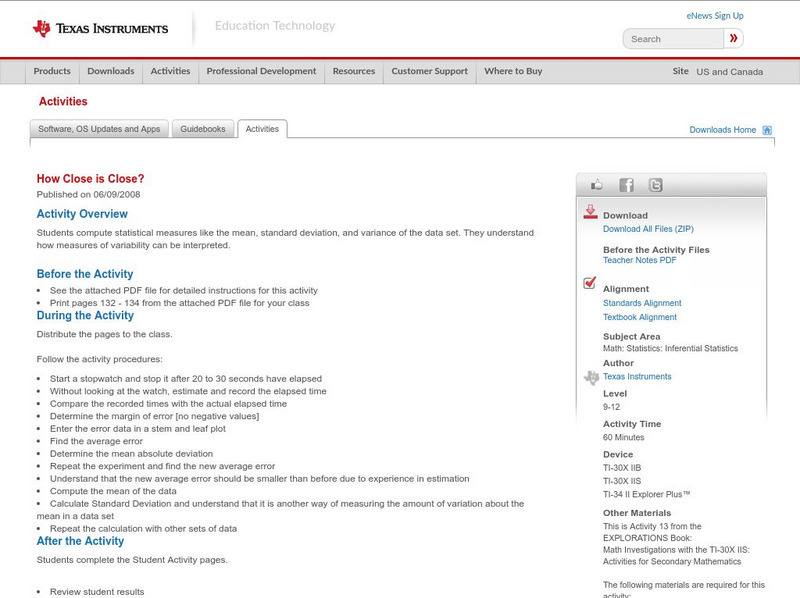
Texas Instruments: How Close Is Close?
In this activity, students compute statistical measures like the mean, standard deviation, and variance of the data set. They understand how measures of variability can be interpreted.
Texas Instruments
Texas Instruments: Analyzing Variance (Anova)
Students analyze variances of various data samples.
Texas Instruments
Texas Instruments: Simulation of Sampling Distributions
This set contains questions about simulating sampling distributions. Students see graphs of simulated distributions enabling them to reach conclusions about mean, shape, and standard deviation.
Texas Instruments
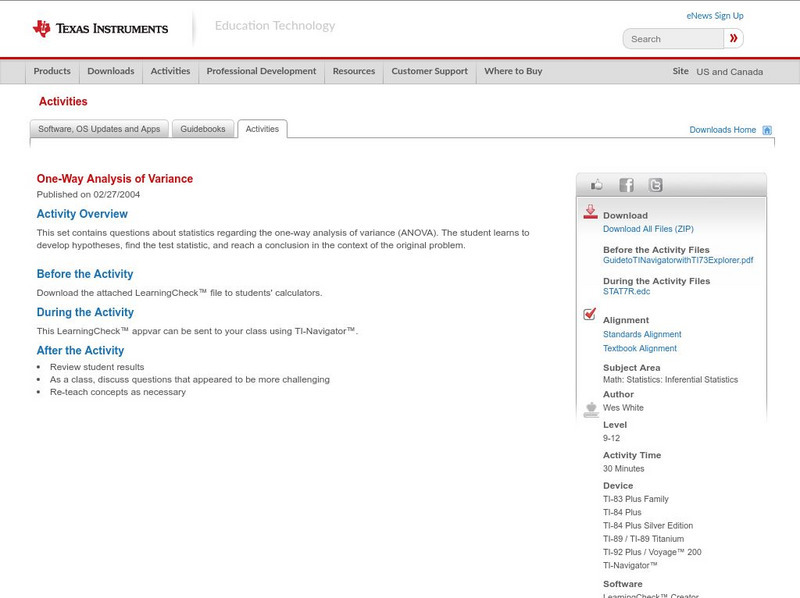
Texas Instruments: One Way Analysis of Variance
This set contains questions about statistics regarding the one-way analysis of variance (ANOVA). The student learns to develop hypotheses, find the test statistic, and reach a conclusion in the context of the original problem.
Texas Instruments
Texas Instruments: Summarizing Distributions of Univariate Data
Students understand statistical concepts like center of data and the amount of data variation from the center. They calculate the measures of the center of a distribution and the measures of spread for the data collected as a list....
Texas Instruments
Texas Instruments: Tests of Significance
Students understand how tests of significance can be performed with confidence intervals. They use a simulation to clarify the meaning of a hypothesis. Students examine large sample tests for a proportion, mean, difference between two...
Stefan Warner and Steven R. Costenoble
Finite Mathematics & Applied Calculus: Measures of Central Tendency
Students learn about measures of central tendency. Topics explored are mean, median, mode, and expected value. The tutorial investigates the statistics concepts through class notes and examples. Review exercises and a chapter quiz are...
Stefan Warner and Steven R. Costenoble
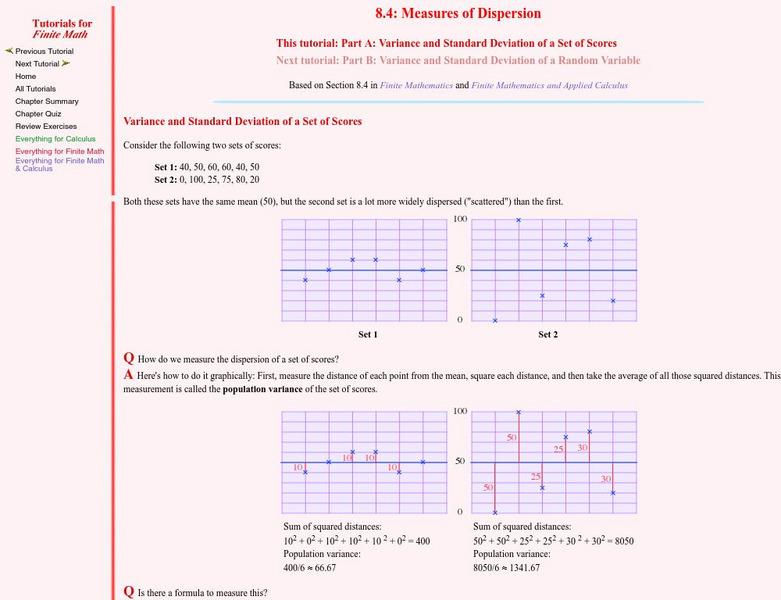
Finite Mathematics & Applied Calculus: Variance and Standard Deviation of a Set of Scores
Students learn about the variance and standard deviation of a set of scores. Topics explored are the empirical rule and Chebyshev's rule. The tutorial investigates the statistics concepts through class notes and examples. Review...
Stefan Warner and Steven R. Costenoble
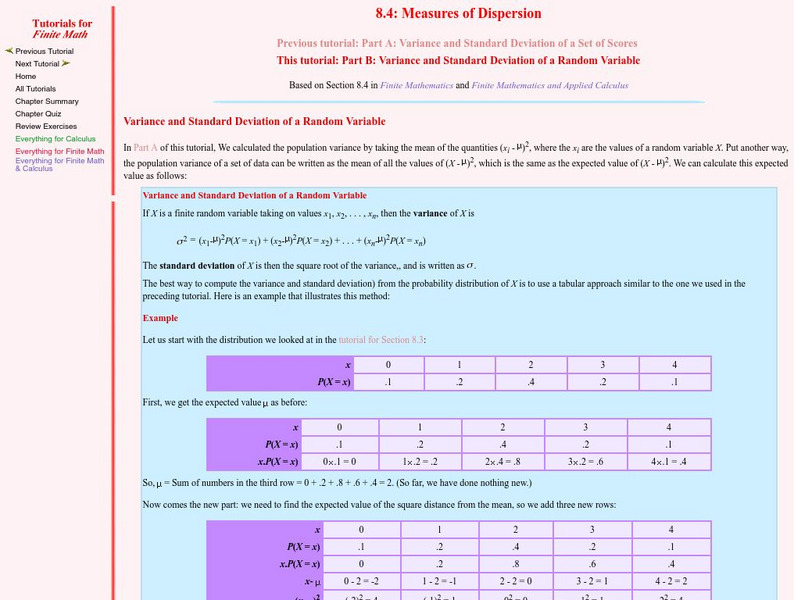
Finite Mathematics & Applied Calculus: Variance and Standard Deviation of a Random Variable
Students learn about the variance and standard deviation of a random variable. The tutorial investigates the statistics concepts through class notes and examples. Review exercises and a chapter quiz are included.
University of Baltimore
University of Baltimore: Sampling Distribution
A complete definition of sampling distribution as well as the beginning of a discussion concerning were sampling distribution fits into the topic of statistics. Written by Dr. Hossein Arsham.
Other
Online Statistics Education: Measures of Variability
Learning Objectives cover the areas of the Measures of Variability. Explanations are given for: variability, range, interquartile range, variance, and standard deviation. Examples and quizzes are also provided.
Other
Fayetteville State Univ.: Sampling Distributions
A detailed explanation of statistical sampling distributions is provided here. Several graphs are attached to aid in understanding. The sampling distribution of the mean and the Central Limit Theorem are also discussed at this site.
McGraw Hill
Glencoe Mathematics: Quiz on Measures of Central Tendency
Students examine advanced mathematics concepts with this online quiz. The assessment shows comprehension of measures of central tendency. Topics include mean, mode, and median.
McGraw Hill
Glencoe: Online Study Tool: Quiz on Measures of Variability
Students demonstrate advanced mathematics skills with this online quiz. The questions check understanding on measures of variability. Topics include variance, standard deviation, and frequency tables.
Science Education Resource Center at Carleton College
Serc: Understanding the Standard Deviation: What Makes It Larger or Smaller?
Students develop a better intuitive understanding of what is meant by variability in statistics. Emphasis is placed on the standard deviation as a measure of variability.
Science Education Resource Center at Carleton College
Serc: Simulating the Effect of Sample Size on Sampling Distribution of the Mean
Using a Java simulation tool, young scholars investigate how sample size is related to the amount of variability one sees in the sampling distribution of the mean. Increasing the sample size decreases the variability. Students are...
Science Education Resource Center at Carleton College
Serc: Using an Applet to Demonstrate a Sampling Distribution
In this activity students are exposed to the concept of sampling distributions by creating an example as a class. By having the students assemble the data, they can more readily understand that a sampling distribution is made up of a...
Texas Instruments
Texas Instruments: Determining Sample Size for a Given Margin of Error
This set contains questions about statistics involving how to choose a sample size to fit a desired maximum error bound. The student learns to do this on confidence intervals for proportions as well as confidence intervals for means.
Texas Instruments
Texas Instruments: Special Cases of Normally Distributed Data
Students perform single and two-sample t procedures to investigate special cases of normally distributed data. They explore inference for a least-square regression line, including the confidence interval.
Khan Academy
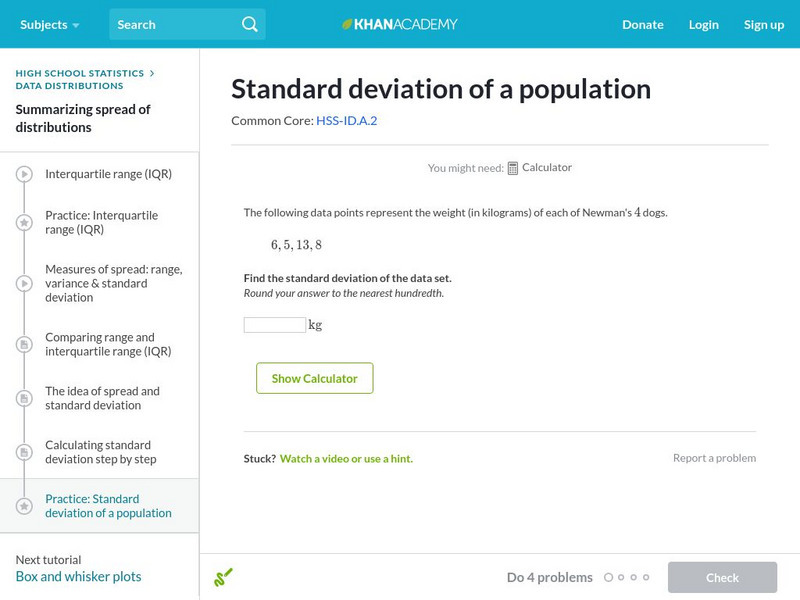
Khan Academy: Standard Deviation of a Population
Calculate the standard deviation of a population. Students receive immediate feedback and have the opportunity to try questions repeatedly, watch a video or receive hints.
University of Illinois
University of Illinois: Mste: How Much Do Baseball Players Really Make?
An interesting real-world use of statistical variance and standard deviation to help dispell the common perception that all major league baseball players are paid millions of dollars and are not worth it. The lesson plan gives specific...
Illustrative Mathematics
Illustrative Mathematics: Measuring Variability in a Data Set
The purpose of this student task is to develop understanding of standard deviation. Aligns with S-ID.A.2 and S-ID.A.3.


