Khan Academy
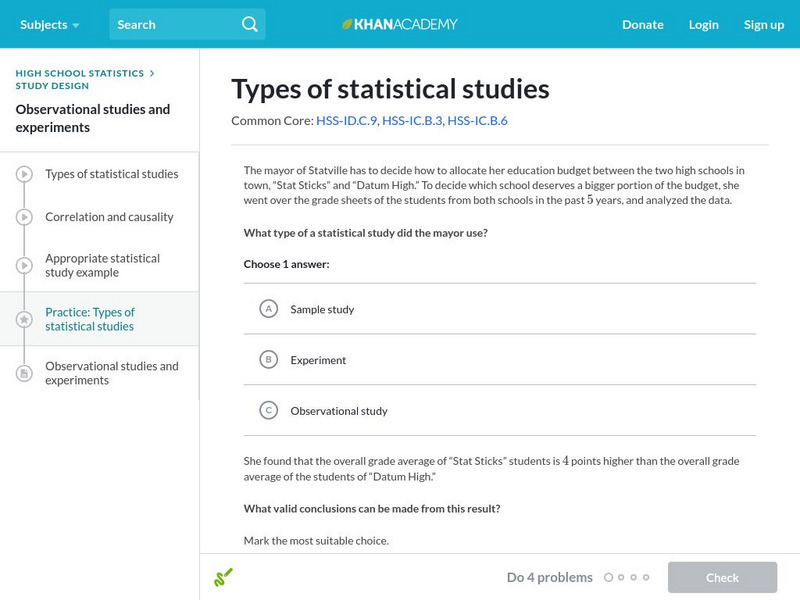
Khan Academy: Types of Statistical Studies
Determine if a statistical study is a sample study, an experiment, or an observational study. Students receive immediate feedback and have the opportunity to try questions repeatedly, watch a video or receive hints.
University of New Brunswick (Canada)
University of New Brunswick: Sample, Random, Systematic, Stratified Sampling
This site contains explanations and examples of the different kinds of data sampling.
Texas Instruments
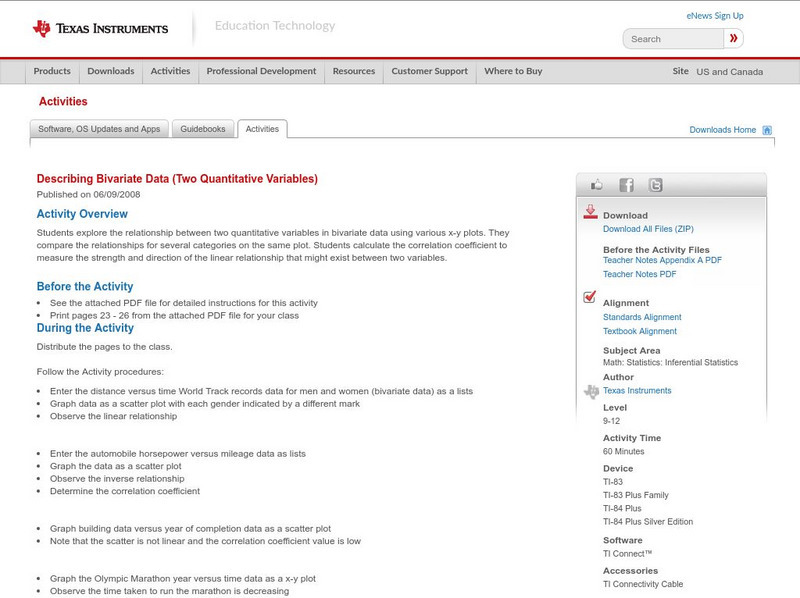
Texas Instruments: Describing Bivariate Data (Two Quantitative Variables)
Students explore the relationship between two quantitative variables in bivariate data using various x-y plots. They compare the relationships for several categories on the same plot. Students calculate the correlation coefficient to...
Khan Academy
Khan Academy: Hypothesis Testing in Experiments
Look at the results of different experiments, and determine if they are statistically significant. Students receive immediate feedback and have the opportunity to try questions repeatedly, watch a video or receive hints.
University of Illinois
University of Illinois: Mste: How Much Do Baseball Players Really Make?
An interesting real-world use of statistical variance and standard deviation to help dispell the common perception that all major league baseball players are paid millions of dollars and are not worth it. The lesson plan gives specific...
Texas Instruments
Texas Instruments: Numb3 Rs: Is It for Real?
Based off of the hit television show NUMB3RS, this lesson uses sabermetrics (study of statistics of baseball) to try to determine when certain players had "change points," or times when their performance drastically changed. This is done...
CK-12 Foundation
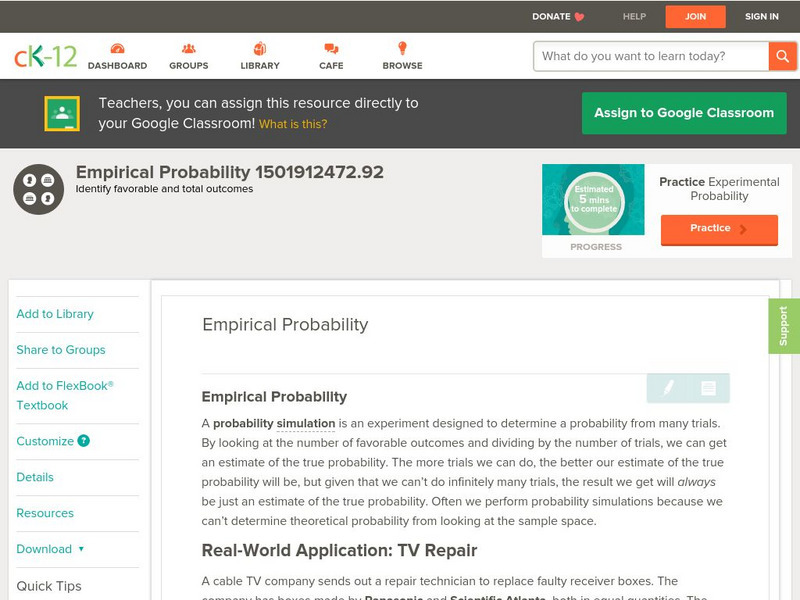
Ck 12: Probability: Empirical Probability
[Free Registration/Login may be required to access all resource tools.] Simulate real-life situations with an experiment and find the experimental probability of a specific event.
CK-12 Foundation
Ck 12: Collecting Data From Experiments: Experiment Techniques
[Free Registration/Login may be required to access all resource tools.] This Concept introduces students to good design for statistical studies or experiments.
CK-12 Foundation
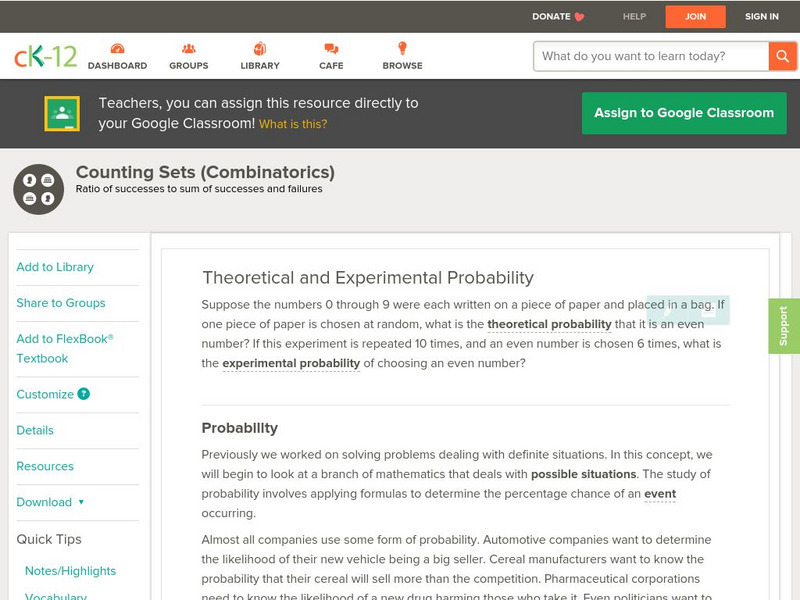
Ck 12: Probability: Theoretical and Experimental Probability
[Free Registration/Login may be required to access all resource tools.] Here you'll learn about theoretical and experimental probability, including how to describe sample spaces and how to conduct probability simulations. Includes...
Alabama Learning Exchange
Alex: My Peanut Butter Is Better Than Yours!
The students will engage in the process of statistical data comparing data using tables and scatterplots. The students will compare data using measures of center (mean and median) and measures of spread (range). This lesson can be done...
Alabama Learning Exchange
Alex: Statistically Thinking
The object of this project is for students to learn how to find univariate and bivariate statistics for sets of data. Also, the students will be able to determine if two sets of data are linearly correlated and to what degree. The...
Shodor Education Foundation
Shodor Interactivate: Advanced Fire
Run a simulation of how a fire spreads through a stand of trees, learning about probability and chaos. Track the results of multiple burns and use the data to draw conclusions.
Shodor Education Foundation
Shodor Interactivate: Life
Run the classic game of life, learning about probabilities, chaos and simulation. This activity allows the user to run a randomly generated world or test out various patterns.
Shodor Education Foundation
Shodor Interactivate: Comparison of Univariate and Bivariate Data
Young scholars learn about the difference between univariate and bivariate data and understand how to choose the best graph to display the data.
CK-12 Foundation
Ck 12: 6.8 Comparing Two Groups
This lesson applies the principals of hypothesis testing to situations involving two samples. It identifies situations with different types of samples, and explores how to test hypotheses about the difference of proportions or means...
Khan Academy
Khan Academy: Scatterplots and Correlation Review
A scatterplot is a type of data display that shows the relationship between two numerical variables. Each member of the dataset gets plotted as a point whose x-y coordinates relates to its values for the two variables.
Houghton Mifflin Harcourt
Holt, Rinehart and Winston: Homework Help Independent Practice: Use a Simulation
Get independent practice using a simulation. Each incorrect response gets a text box explanation and another try. Correct responses are confirmed.
Shodor Education Foundation
Shodor Interactivate: Dictionary: Experimental Probability
This interactive dictionary gives the definition of experimental probability. Be sure to follow the link to a discussion on probabilities and outcomes.
ClassFlow
Class Flow: Analyzing Data Mean, Median and Mode
[Free Registration/Login Required] Explores ways of analyzing data in a table.
ClassFlow
Class Flow: Card Games Handling Data
[Free Registration/Login Required] This is a fun game using cards and challenging students to think of probabilities.
Varsity Tutors
Varsity Tutors: Hotmath: Statistical Questions
Explains what a statistical question is and when and how central tendency and the spread of the data are relevant.
Other
Minitab: Comparison of Categorical and Quantitative Variables
This resource explains the difference between categorical and quantitative variables and provides examples of each.
BBC
Bbc: Statistical Skills: Comparing Data Sets Using Statistics
This site is a demonstration of Comparing data sets using statistics and forming a linear model from a given set of data. Examples and a practice test are included.
Interactive Mathematics
Interactive Mathematics: Intoduction to Probability Theory
This tutorial defines experiment, sample space, and event. Several examples are presented to help distinguish between them.


