Shmoop University
Shmoop: Basic Statistics & Probability: Designing a Study
Presents the steps to follow in designing a study in statistics and explains what makes a good statistical question.
Texas Instruments
Texas Instruments: Using a Table to Make Conjectures
This activity is used to practice making tables for investigating a geometrical problem and to develop techniques for trying different constructions to prove a theorem.
University of Regina (Canada)
University of Regina: Math Central: Scatter Plots
Three different concepts are examined about scatter plots. Topics featured are collecting data, analyzing scatter plots, and determining a line of "best fit". The activity has an overview, material, procedures, and evaluation techniques.
Texas Instruments
Texas Instruments: Linear Functions Modeled by Data
Students submit their own data that can be modeled by a linear function. Students find the line of best fit, and discuss graphs of linear functions.
Texas Instruments
Texas Instruments: Probability Distributions
In this activity, students use the Derive software to compute binomial, hypergeometric, standard normal and normal probabilities, and explore inverse normal computations.
McGraw Hill
Glencoe Mathematics: Online Study Tool: Self Check Quiz on Sample Sets of Data
This quiz tests students on advanced mathematics skills in Algebra II. The questions help build comprehension on sample sets of data.
McGraw Hill
Glencoe Mathematics: Online Study Tools: Scatter Plots
This site gives a short interactive quiz which allows students to self-assess their understanding of the concept of scatter plots.
Texas Instruments
Texas Instruments: The Normal Distribution
Students graph normal distributions, shade desired areas, and find related probabilities. They graph Normal probability scatter plots to check the normal (linear) shape of a data distribution.
Texas Instruments
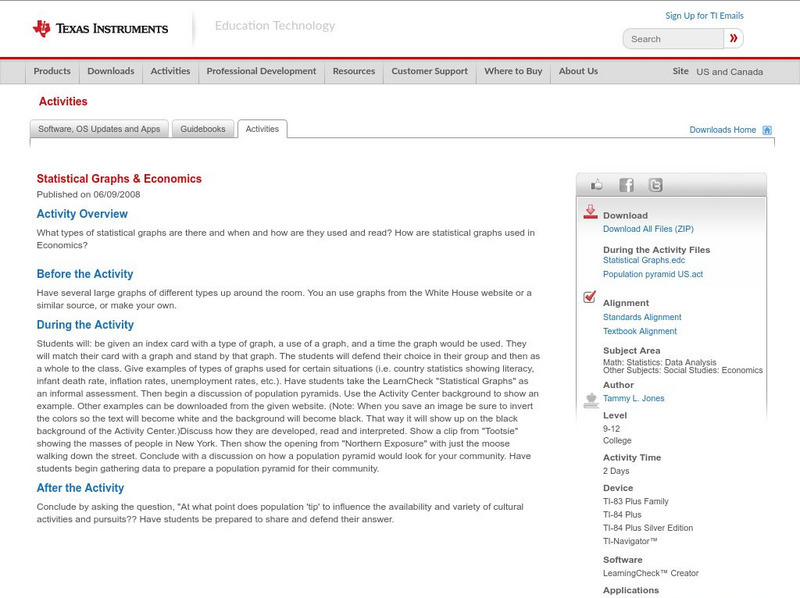
Texas Instruments: Statistical Graphs & Economics
What types of statistical graphs are there and when and how are they used and read? How are statistical graphs used in Economics?
Other
Vlps: Mean and Standard Deviation
Explanation of frequency distributions, mean, standard deviations, and variance including a Java Applet.
Michigan Technological University
Computing Mean, Variance and Standard Deviation
Page centered around a computer program to determine mean, variance, and standard deviation.
Rice University
Hyper Stat Online Statistics Textbook: Chapter 3: Describing Bivariate Data
This chapter of an online textbook begins with a description of scatterplots, then focuses on the Pearson Product Moment Correlation.
Texas Instruments
Texas Instruments: Exploring Bivariate Data
Students graph scatter plots and understand the concepts of correlation and least-squares regression. They also perform transformations to achieve linearity in the data plot.
National Council of Teachers of Mathematics
The Math Forum: Nctm: Ask Dr. Math: Stem and Leaf and Scatter Plots
This site is a question/response page which focuses on stem-and-leaf representation and how to construct scatter plots. Dr. Math works through an example and gives commentary notes. Site also contains links for more help.
National Council of Teachers of Mathematics
The Math Forum: Data Collecting Project Stats Class
This lesson plan provides the teacher with all the necessary handouts and directions to give a statistics class when they are ready to complete a thorough survey project. Broken into five parts, it takes the students through the...
Oswego City School District
Regents Exam Prep Center: Practice With Organizing and Interpreting Data
Several problems are presented to test your skills in creating and interpreting frequency tables, pie charts, box-and-whisker and stem-and-leaf plots.
Math Planet
Math Planet: Pre Algebra: Probability of Events
Discover how to find the probability of an event by taking a look at examples and a video lesson.
Math Planet
Math Planet: Scatter Plots and Linear Models
Provides examples and a video lesson that explains scatter plots.
Math Planet
Math Planet: Algebra 2: Standard Deviation and Normal Distribution
Gain an understanding of standard deviation and normal distribution by viewing an example and a video lesson.
Khan Academy
Khan Academy: Expected Value With Calculated Probabilities
Find expected value based on calculated probabilities. Students receive immediate feedback and have the opportunity to try questions repeatedly, watch a video or receive hints.
Khan Academy
Khan Academy: Discrete Random Variables: Expected Value
Compute the expected value given a set of outcomes, probabilities, and payoffs. Students receive immediate feedback and have the opportunity to try questions repeatedly or receive hints.
University of Illinois
University of Illinois: Mste: How Much Do Baseball Players Really Make?
An interesting real-world use of statistical variance and standard deviation to help dispell the common perception that all major league baseball players are paid millions of dollars and are not worth it. The lesson plan gives specific...
Texas Instruments
Texas Instruments: Numb3 Rs: Is It for Real?
Based off of the hit television show NUMB3RS, this lesson uses sabermetrics (study of statistics of baseball) to try to determine when certain players had "change points," or times when their performance drastically changed. This is done...
National Council of Teachers of Mathematics
Nctm: Illuminations: Adjustable Spinner
An interactive game for learning theoretical vs experimental probability.


