Other
Magoosh: Statistics Fundamentals
An online course on the fundamentals of statistics including video lessons in Mean, Median, and Mode; Weighted Averages; Quartiles and Boxplots; Range and Standard Deviation; Normal Distribution; Z-scores; Intro to Inferential...
Stefan Warner and Steven R. Costenoble
Finite Mathematics & Applied Calculus: Bayes' Theorem and Applications
Students examine Bayes theorem. The tutorial investigates the statistics concept through class notes and examples. Review exercises and a chapter quiz are included.
CK-12 Foundation
Ck 12: Probability: Empirical Probability
[Free Registration/Login may be required to access all resource tools.] Simulate real-life situations with an experiment and find the experimental probability of a specific event.
CK-12 Foundation
Ck 12: Statistics: Surveys and Sample
[Free Registration/Login may be required to access all resource tools.] Learn how to use surveying and sampling to collect accurate data.
CK-12 Foundation
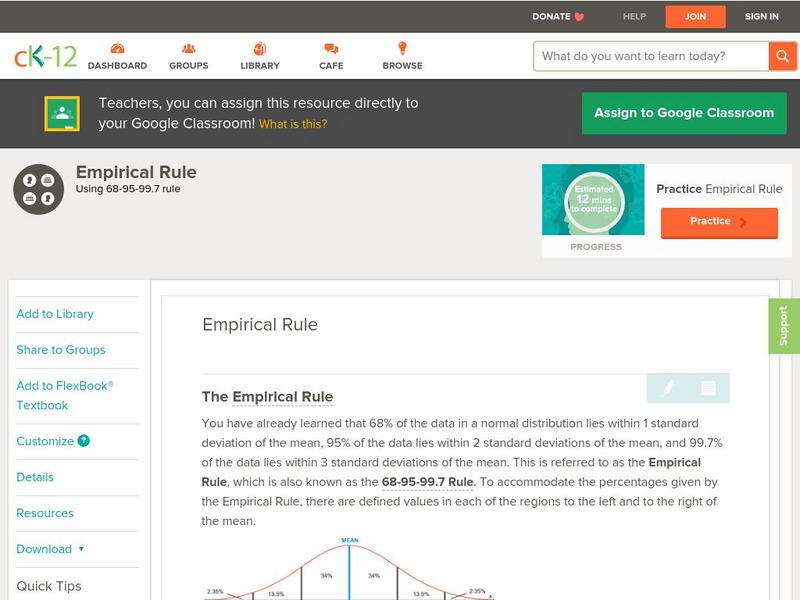
Ck 12: Probability: Empirical Rule
[Free Registration/Login may be required to access all resource tools.] Use percentages associated with normal distributions to solve problems.
CK-12 Foundation
Ck 12: Mean and Standard Deviation of Discrete Random Variables
[Free Registration/Login may be required to access all resource tools.] This Concept teaches students how to find the mean and standard deviation for discrete random variables.
CK-12 Foundation
Ck 12: Statistics: Scatter Plots on the Graphing Calculator
[Free Registration/Login may be required to access all resource tools.] This lesson covers finding the equation of best fit using a graphing calculator.
Alabama Learning Exchange
Alex: Ballistic Statistics!
Students will collect examples of various statistical instruments and form an electronic scrapbook. These materials will be gathered from electronic sources in addition to periodicals and other print resources.
Alabama Learning Exchange
Alex: Dartboard Probability
In this lesson students will find probability of events presented in a geometric context. This lesson plan was created by exemplary Alabama Math Teachers through the AMSTI project.
Alabama Learning Exchange
Alex: Statistically Thinking
The object of this project is for students to learn how to find univariate and bivariate statistics for sets of data. Also, the students will be able to determine if two sets of data are linearly correlated and to what degree. The...
Khan Academy
Khan Academy: Two Way Tables Review
Two-way tables organize data based on two categorical variables.
National Council of Teachers of Mathematics
Nctm: Illuminations: Advanced Data Grapher
The Advanced Data Grapher can be used to analyze data with box plots, bubble graphs, scatterplots, histograms, and stem-and-leaf plots.
National Council of Teachers of Mathematics
Nctm: Illuminations: Line of Best Fit
Use this activity to practice how to enter a set of data, plot the data on a coordinate grid, and determine the equation for a line of best fit.
CK-12 Foundation
Ck 12: Using Probability to Make Decisions
Use this Common Core Math Standards Browser to search specific math concepts and their corresponding standards. This page focuses on Using Probability to Make Decisions. Click on the links to find lessons, activities, videos, and study...
Shodor Education Foundation
Shodor Interactivate: Multiple Linear Regression
Students compare multiple independent variables as predictors of one dependent variable. Students explore correlation and lines of best-fit.
Shodor Education Foundation
Shodor Interactivate: Advanced Fire
Run a simulation of how a fire spreads through a stand of trees, learning about probability and chaos. Track the results of multiple burns and use the data to draw conclusions.
Shodor Education Foundation
Shodor Interactivate: Regression
Plot a bivariate data set, determine the line of best fit for their data, and then check the accuracy of your line of best fit.
Shodor Education Foundation
Shodor Interactivate: Normal Distribution
Change the standard deviation of an automatically generated normal distribution to create a new histogram. Observe how well the histogram fits the curve, and how areas under the curve correspond to the number of trials.
Khan Academy
Khan Academy: Computing Basic Statistics
Computing data statistics by examining data patterns.
Shodor Education Foundation
Shodor Interactivate: Comparison of Univariate and Bivariate Data
Young scholars learn about the difference between univariate and bivariate data and understand how to choose the best graph to display the data.
CK-12 Foundation
Ck 12: Algebra Ii: 5.8 Evaluating Reports
Learn to analyze examples of claims presented in the media that involve estimating a population proportion and population mean.
CK-12 Foundation
Ck 12: Algebra Ii: 5.7 Margin of Error
This section introduces the concept of Margin of Error. Explore how results from surveys are most accurate within a range of values, and use this concept to make inferences about the preferences of a full population, given data from a...
CK-12 Foundation
Ck 12: Algebra Ii: 5.4 Standard Deviation
Explore what the standard deviation is as it relates to the graph of a normal distribution curve.


