Khan Academy
Khan Academy: Scatterplots and Correlation Review
A scatterplot is a type of data display that shows the relationship between two numerical variables. Each member of the dataset gets plotted as a point whose x-y coordinates relates to its values for the two variables.
Quia
Ixl Learning: Scatter Plots
Brush up on your math skills relating to scatter plots then try some practice problems to test your understanding.
Hofstra University
Hofstra University: Review Exercises Random Variables..
Interactive review problems are offered to practice the concepts of random variables and statistics. Topics covered include, Bernoulli trials, normal and binomial distributions, Chebyshev's rule, and the like.
Shodor Education Foundation
Shodor Interactivate: Simple Plot
A java applet that helps a student to create a scatter plot using the coordinates and axes and given data.
Richland Community College
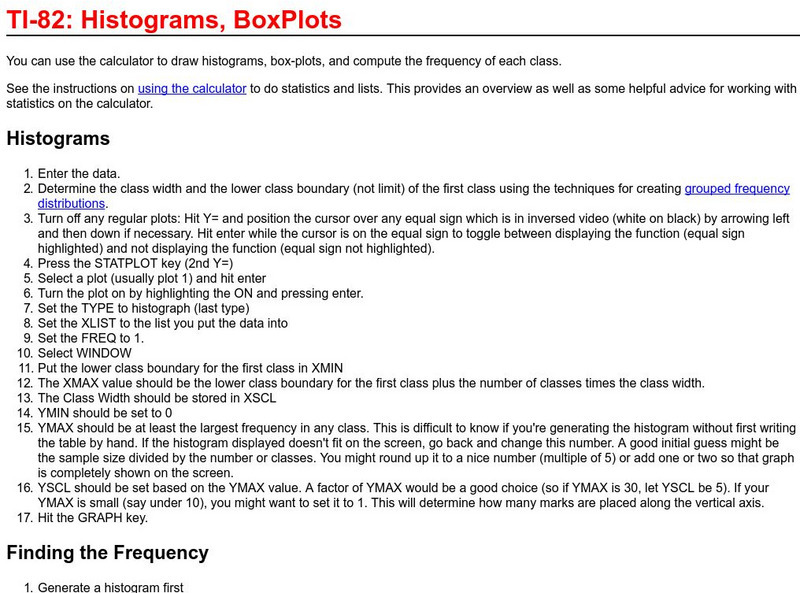
Richland College: Ti 82 Histograms / Box Plots
Richland College provides a step-by-step procedure on how to use a TI-82 to construct histograms and box plots and then use this to find frequency distribution.
Shodor Education Foundation
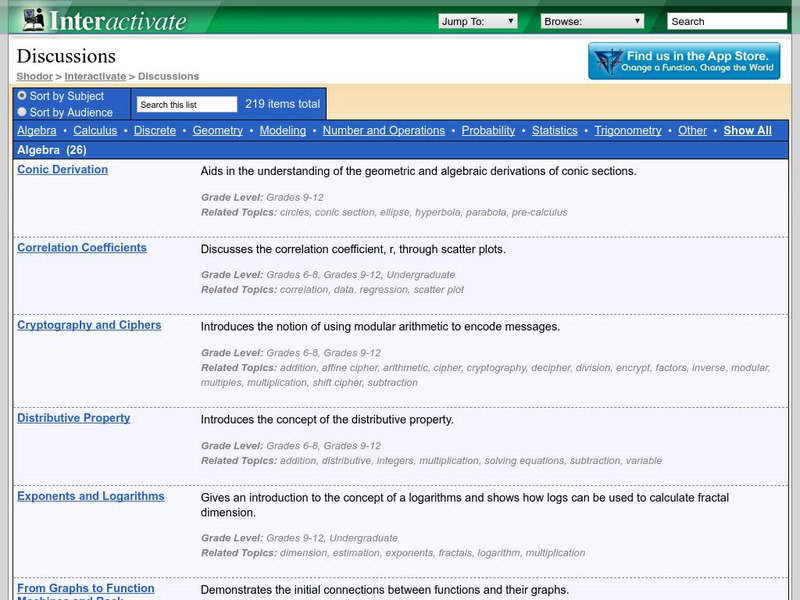
Shodor Interactivate: Stats and Probability Concepts
Many topics on Statistics and Probability are defined and linked here. Click on any of them to move to a more detailed discussion of the term.
Richland Community College
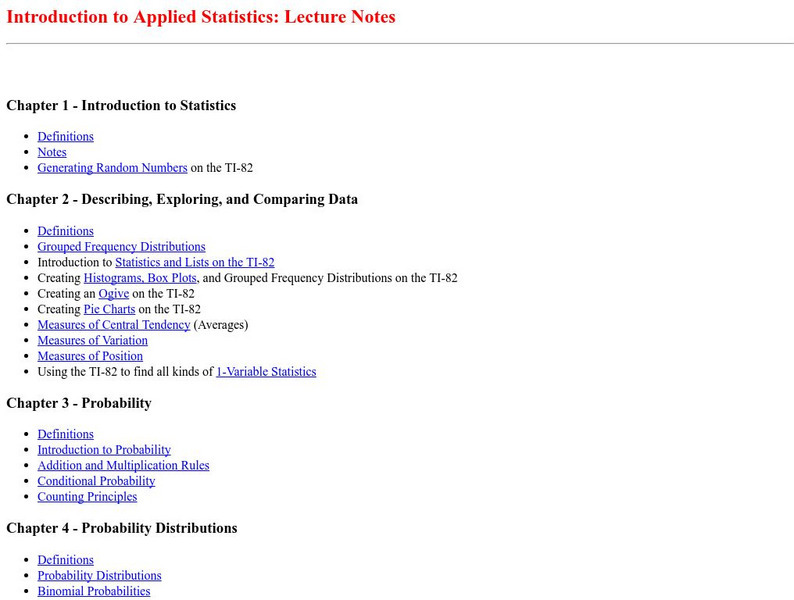
Richland Community: Introduction to Applied Statistics
This site from the Richland Community College provides lecuture notes from a class neatly organized and easy to read. Has some good information.
Rice University
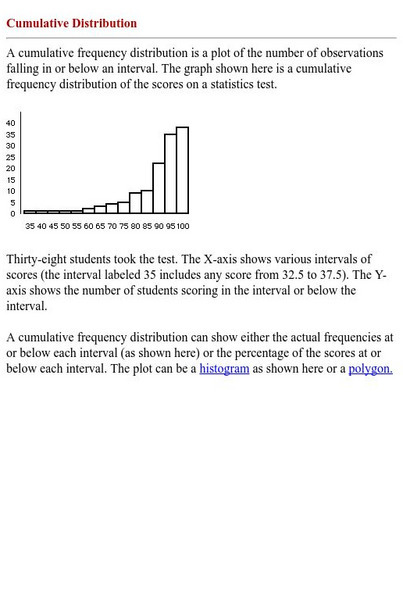
Hyper Stat Online Statistics Textbook: Cumulative Distribution
This resoruce explains how to read a cumulative frequency distribution graph.
Rice University
Hyper Stat Online Statistics Textbook: Contingency Table
A brief explanation and example of what a statistical contingency table is.
Stefan Warner and Steven R. Costenoble
Finite Mathematics & Applied Calculus: Review Exercises: Sampling Statistics
Students review sampling statistics. The resource consists of review exercises on the mathematics concepts.
California State University
Cal State San Bernardino: Intro to Probability Models
The concept of random variables comes to life with this Applet used to roll one, two, six, or nine dice. The user selects the number of rolls to be completed, and the program quickly counts and graphs the results.
PBS
Pbs Teachers: Sports and Math: Batting Averages and More
Set up a spreadsheet using a computer or graphing calculator, and perform calculations using columns. Calculate percentages and solve a system of equations regarding baseball statistics.
Math Graphs
Houghton Mifflin: Math Graphs: Fitting Models to Scatter Plots 1 [Pdf]
Students use a scatter plot to determine whether data can be modeled by a linear function, a quadratic function, a trigonometric function, or that there appears to be no relationship between x and y. The resource consists of an enlarged...
Math Graphs
Houghton Mifflin: Math Graphs: Fitting Models to Scatter Plots 2 [Pdf]
Students use a scatter plot to determine whether data can be modeled by a linear function, a quadratic function, a trigonometric function, or that there appears to be no relationship between x and y. The resource consists of an enlarged...
Math Graphs
Houghton Mifflin: Math Graphs: Fitting Models to Scatter Plots 3 [Pdf]
Students use a scatter plot to determine whether data can be modeled by a linear function, a quadratic function, a trigonometric function, or that there appears to be no relationship between x and y. The resource consists of an enlarged...
Math Graphs
Houghton Mifflin: Math Graphs: Fitting Models to Scatter Plots 4 [Pdf]
Learners use a scatter plot to determine whether data can be modeled by a linear function, a quadratic function, a trigonometric function, or that there appears to be no relationship between x and y. The resource consists of an enlarged...
Math Graphs
Houghton Mifflin: Math Graphs: Line of Best Fit 1 [Pdf]
The practice problem examines the line of best fit and scatter plots. The scatter plot is available in PDF format.
Math Graphs
Houghton Mifflin: Math Graphs: Line of Best Fit 2 [Pdf]
The practice problem examines the line of best fit and scatter plots. The scatter plot is available in PDF format.
Math Graphs
Houghton Mifflin: Math Graphs: Line of Best Fit 3 [Pdf]
Students sketch the line that best approximates the data in a scatter plot. The scatter plot is available in PDF format.
Math Graphs
Houghton Mifflin: Math Graphs: Line of Best Fit 4 [Pdf]
Learners sketch the line that best approximates the data in a scatter plot. The scatter plot is available in PDF format.
Math Graphs
Houghton Mifflin: Math Graphs: Line of Best Fit 5 [Pdf]
Learners use a scatter plot to determine the line of best fit. The scatter plot is available in PDF format.
Math Graphs
Houghton Mifflin: Math Graphs: Line of Best Fit 6 [Pdf]
Learners use a scatter plot to determine the line of best fit. The scatter plot is available in PDF format.
Math Graphs
Houghton Mifflin: Math Graphs: Line of Best Fit 7 [Pdf]
The practice problem examines the line of best fit and a scatter plot. The scatter plot is available in PDF format.
Math Graphs
Houghton Mifflin: Math Graphs: Line of Best Fit 8 [Pdf]
The practice problem examines the line of best fit and a scatter plot. The scatter plot is available in PDF format.


