ClassFlow
Class Flow: Cumulative Frequency Data Handling
[Free Registration/Login Required] Students draw conclusions and engage in tables and charts involving cumulative frequency; a wonderful review of student's knowledge.
ClassFlow
Class Flow: Donkey Derby Handling Data
[Free Registration/Login Required] Can you list all probabilities when two dice are thrown? Run your own race here and see which donkey wins.
Teachnology
Teachnology: Teacher Guide to Probability and Statistics
Statistics Theme provides a collection of free sample worksheets, teacher resources, lesson plans and interactive media for grades k-12.
Interactive Mathematics
Interactive Mathematics: Probability and Statistics
Mini lessons are provided for learning concepts in the world of probability and statistics. Topics include counting and probability, permutations, combinations, independent and dependent events, and distributions. Links to online...
Shmoop University
Shmoop: Basic Statistics & Probability: Scatter Plots & Correlation
The statistics resource explores scatter plots and correlation. Students learn about the concepts through notes and detailed examples. The resource consists of practice exercises to check for comprehension of the topics.
That Quiz
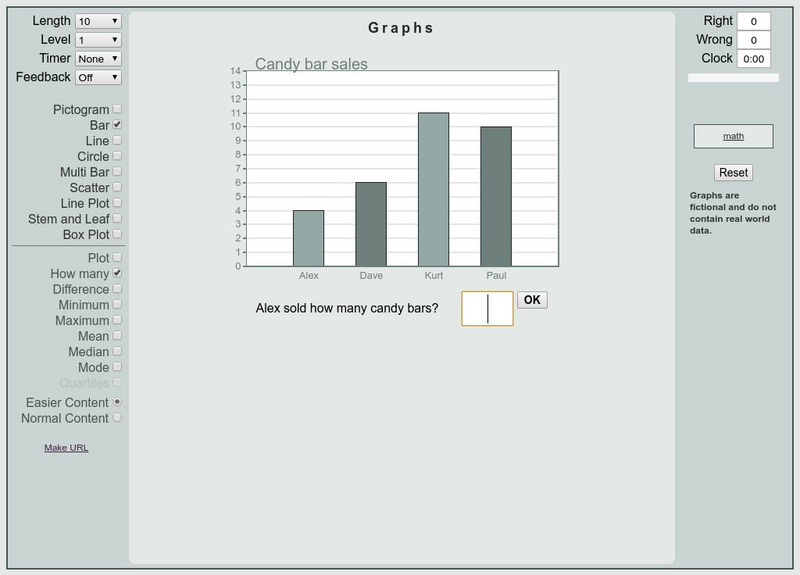
That Quiz: Graficas
This is an interactive practice to review bar graphs, circle graph, scatter plot, etc. Test are timed and keep track of right and wrong answers. Different levels of difficulties are provided.
National Council of Teachers of Mathematics
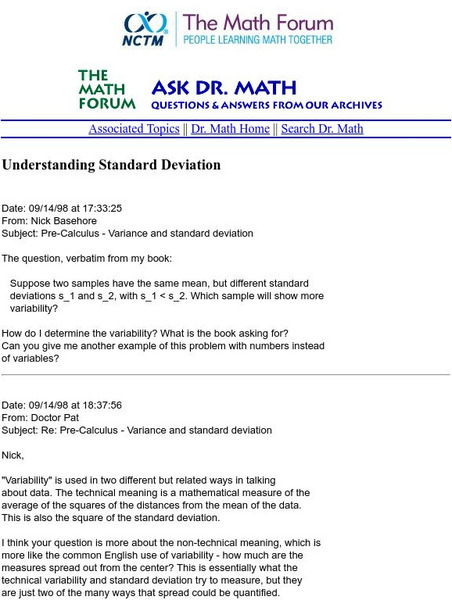
The Math Forum: Understanding Standard Deviation
MathForum answers a question on variance and standard deviation.
Other
Coe College: Definition of Scatter Plot
This Coe College site contains the definition of scatter plot. Glossary and looking at data section included.
National Council of Teachers of Mathematics
The Math Forum: Nctm: Ask Dr. Math: Graphing Scatter Plots
This page is in response to a question that someone emailed Dr. Math. It shows how to make a scatter plot for peoples' height and shoe sizes. The information is somewhat brief, but worth checking out on the subject.
National Council of Teachers of Mathematics
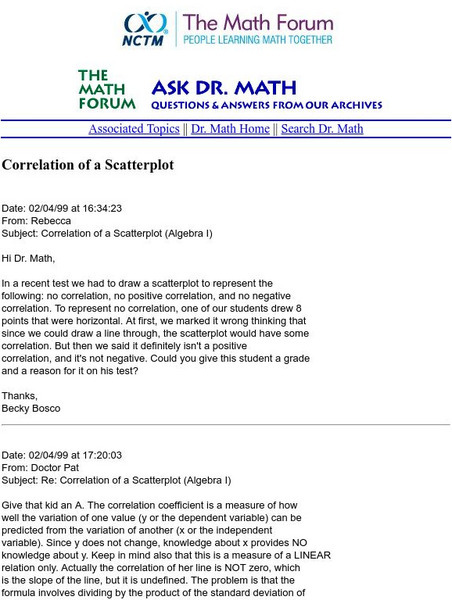
The Math Forum: Nctm: Ask Dr. Math: Correlation of a Scatterplot
This page from Ask Dr. Math describes the correlation of a scatterplot and gives an example of one with no correlation.
Palomar Community College District
Palomar College: Scatter Plot
This site, which is provided for by the Palomar College, gives a sample problem of how to graph a scatter plot, including the appropriate axes.
Varsity Tutors
Varsity Tutors: Hotmath: Statistical Questions
Explains what a statistical question is and when and how central tendency and the spread of the data are relevant.
Other
Meta Calculator: Statistics Calculator
A web-based statistics calculator to find mean, median, standard deviation, variance and ranges.
BBC
Bbc: Standard Deviation
A demonstration of how to find the standard deviation of a set of data. Several examples and a practice test are offered.
BBC
Bbc: Statistical Skills: Comparing Data Sets Using Statistics
This site is a demonstration of Comparing data sets using statistics and forming a linear model from a given set of data. Examples and a practice test are included.
University of Glasgow
Steps Statistics Glossary: Sampling Distribution
This site provides an overview of sampling distribution and associated terms.
University of Glasgow
Steps Statistics Glossary: Random Variables and Probability Distributions
This section of the Statistics Glossary offers definitions of terms having to do with random variables and probability distributions such as expected value and normal distribution.
Iowa State University
Iowa State Univ: Plotting Scatter Plot in X Gobi
Site explains how the XGobi computer program can be used to plot data in a scatter plot.
Other
Berrie's Statistics Page: Normal Distribution
Site discusses the normal distribution as well as the mean and variance in the normal distribution. A link is provided for a QuickTime activity to adjust the mean.


