Curated OER
Fred's Fun Factory
Round and round and round she goes. Where she stops, nobody knows. This activity uses a common arcade game of chance, the spinning wheel, as a platform for computing expected values, interpreting results, and applying this knowledge to...
Curated OER
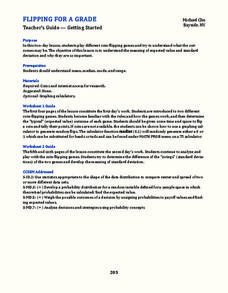
Flipping for a Grade
What happens when your teachers get tired of grading tests and want to use games of chance to determine your grade? How would you decide which game they should play? Learn how to use expected value and standard notation to compare two...
National Research Center for Career and Technical Education
Health Science: Back to Basics
This lesson focuses on unit conversion, proportions, ratios, exponents, and the metric system. Discuss measurement with your math class and demonstrate how to solve several health-science word problems. Give learners a chance to visit an...
Curated OER
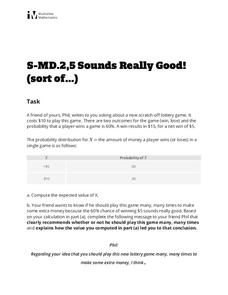
Sounds Really Good! (sort of...)
Your friend Phil wants to know if he should play the lottery. Have your class use the given data to compute the expected value and explain to Phil what he should do and why. This handout is ideal for a quick assessment of skill and...
Massachusetts Institute of Technology
Mit: Open Course Ware: Introduction to Probability and Statistics
The online course consists of educational materials about probability and statistics. Lecture notes, exams, and assignments are included.
Wolfram Research
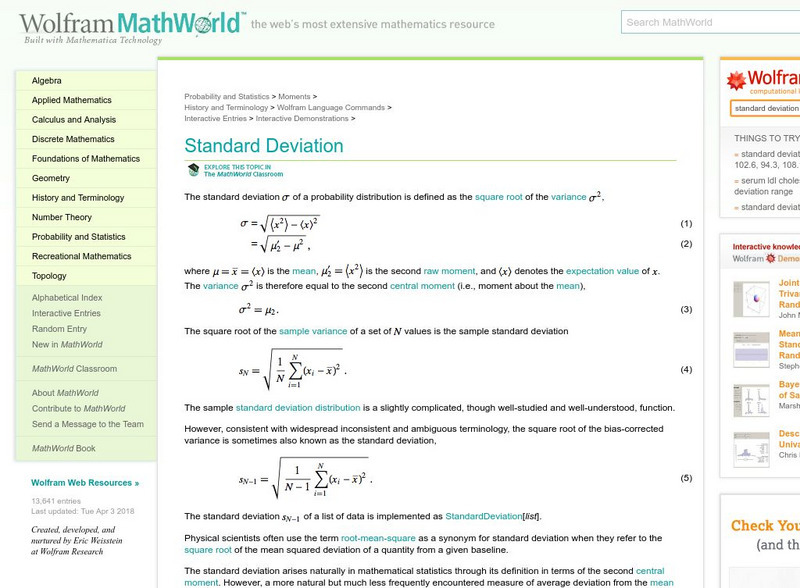
Wolfram Math World: Standard Deviation
This World of Mathematics site by Eric Weisstein explains the term "Standard deviation." Provides step-by-step help, examples, and charts.
University of Colorado
University of Colorado: Ph Et Interactive Simulations: Plinko Probability
Play Plinko and develop your knowledge of statistics. Drops balls through a triangular grid of pegs and see the balls random walk through the lattice. Watch the histogram of final positions build up and approach the binomial distribution.
University of Colorado
University of Colorado: Ph Et Interactive Simulations: Plinko Probability
Drop balls through a triangular grid of pegs and see them accumulate in containers. Switch to a histogram view and compare the distribution of balls to an ideal binomial distribution. Adjust the binomial probability and develop your...
American Association of Physics Teachers
Com Padre Digital Library: Open Source Physics: Binomial Distribution Model
This downloadable mathematics java simulation explores the binomial probability distribution model. The probability and number of trials can be changed to see the effect on the distribution model.
Other
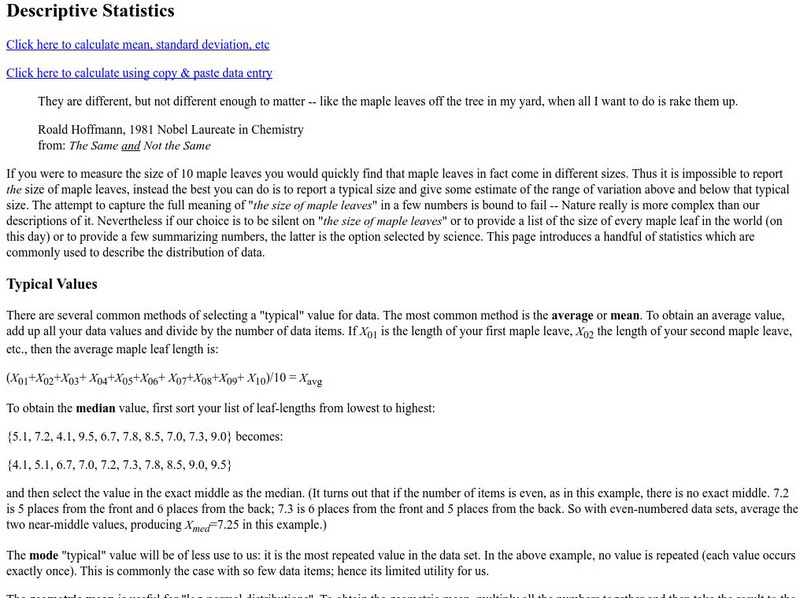
Descriptive Statistics
Very complete explanation of mean, standard deviation, etc. including an online calcluator for these statistics.
Science Education Resource Center at Carleton College
Serc: Seeing and Describing the Predictable Pattern: The Central Limit Theorem
A learning activity where young scholars are guided into discovering the Central Limit Theorem. As they explore sampling distributions, they will identify predictable patterns which can be described with this mathematical theorem....
Texas Instruments
Texas Instruments: Numb3 Rs: Expected Value
Based off of the hit television show NUMB3RS, this lesson attempts to explain the betting system at horse tracks by having students vie for parcels of land on their calculators. Because the land boundaries are unknown until the finale of...
University of Colorado
University of Colorado: Ph Et Interactive Simulations: Curve Fitting
Drag data points and their error bars, and watch the best-fit polynomial curve update instantly. Choose the type of fit: linear, quadratic, cubic, or quartic. The reduced chi-square statistic shows when the fit is good.
Vision Learning
Visionlearning: Statistics: Using Mean, Median, and Standard Deviation
An introduction to recognizing trends and relationships in data through descriptive statistics.
Texas Education Agency
Texas Gateway: Tea Statistics: Confidence Intervals: Practice
A large collection of practice problems on confidence intervals.
Missouri State University
Missouri State University: Introductory Statistics: The Normal Curve
Provides a complete discussion of normal curves in statistics. Site is presented in notes with examples added as needed.
Columbia University
Columbia University: Expected Value Pdf
A PDF explaining and giving examples to show how the expected value of a random variable indicates its weighted average.
Dartmouth College
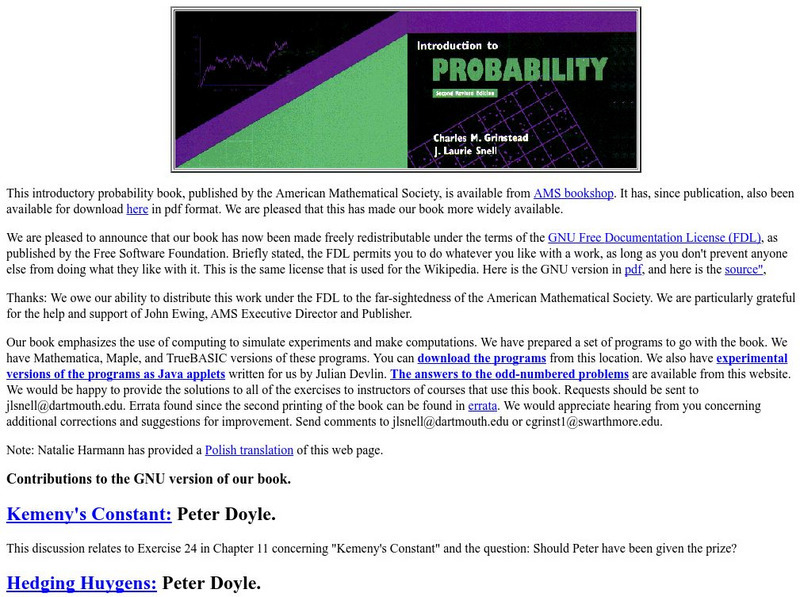
Dartmouth College: An Introduction to Probability
This site provides an introduction to probability book that is available for download. It also gives tips on how to teach and learn the concept of probability.
City University of New York
Measures of Variability
Explanation and examples of variance and standard deviation. Helpful charts and formulas are provided.
Wolfram Research
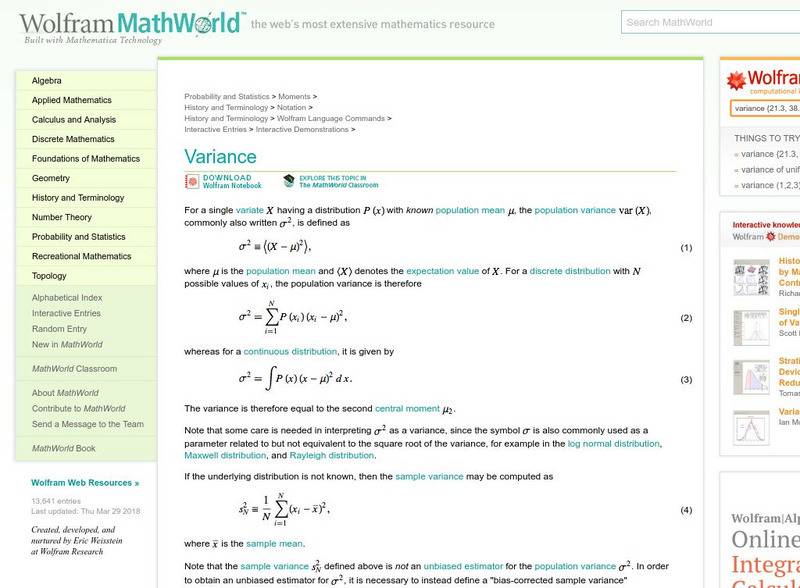
Wolfram Math World: Variance
MathWorld offers a plethora of information on variance. Student should have some statistic knowledge to use this site. This site contains links to related topics.
National Council of Teachers of Mathematics
The Math Forum: Probability and Statistics
This page is a math home page that includes information on all topics of probability and statistics.
Wolfram Research
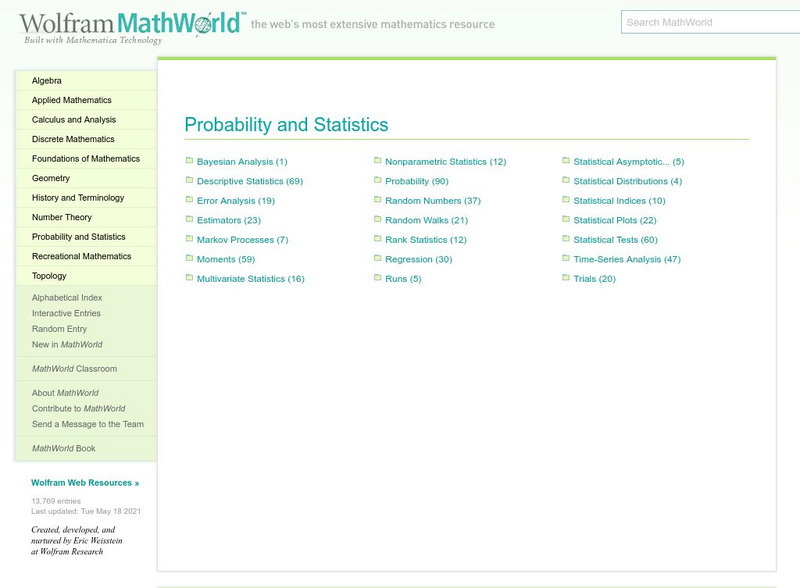
Wolfram Math World: Probability and Statistics
This is a resource for many topics in probability and statistics. Click on the topic of your choice for an explanation. The sites you will be linked to are quite extensive. A degree of higher-level math is necessary for understanding...
Shodor Education Foundation
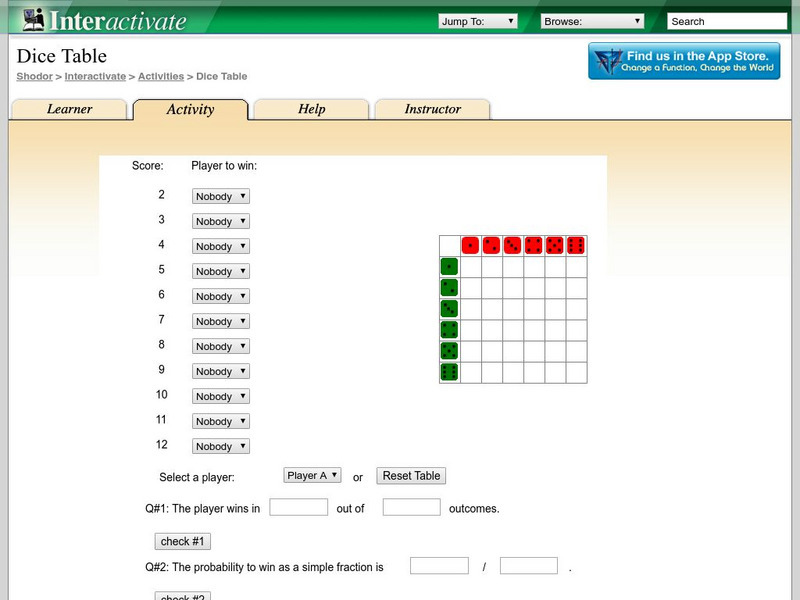
Shodor Interactivate: Dice Table
A dice-table activity introduces students to probability and to converting probability to a simple fraction, a decimal, and a percentage.
University of Colorado
University of Colorado: Normal Probabilities Applet #3
The Applet illustrates how to use the old-fashioned tables of normal probabilities and areas under the normal distribution cureve to arrive at corresponding graphs of the areas. A good resource for the topic.


