Math Is Fun
Math Is Fun: Standard Deviation and Variance
Standard devaition and variance are explained clearly, accompanied by an examples using the size of dogs.
Sophia Learning
Sophia: Introduction to Probability
Introduction to Probability is a resource that provides assessment and teacher tutorials that focus on mathematic concepts such as probability, outcomes, events, probability distribution, laws, values and odd.
Sophia Learning
Sophia: Practical Applications of the Bell Shaped Curve
Explore the bell-shaped curve and how to calculate a z score. Additional links provided to further knowledge on outliers.
Varsity Tutors
Varsity Tutors: Hotmath: Practice Problems: Binomial Probability and Binomial Distribution
Sixteen problems present a variety of practice working with binomial probability and binomial distribution. They are given with each step to the solution cleverly revealed one at a time. You can work each step of the problem then click...
Texas Instruments
Texas Instruments: Plums and the Normal Distribution
This lesson demonstrates how the calculator's built-in numeric solver can be used along with the normalcdf function to answer a variety of Normal Distribution questions.
Texas Instruments
Texas Instruments: Probability Distributions
In this activity, students use the Derive software to compute binomial, hypergeometric, standard normal and normal probabilities, and explore inverse normal computations.
Texas Instruments
Texas Instruments: Special Cases of Normally Distributed Data
Students perform single and two-sample t procedures to investigate special cases of normally distributed data. They explore inference for a least-square regression line, including the confidence interval.
CK-12 Foundation
Ck 12: Binomial Distributions and Probability Grade 11 12
[Free Registration/Login may be required to access all resource tools.] This Concepts introduces students to the binomial probability distribution.
CK-12 Foundation
Ck 12: Binomial Distributions and Probability
[Free Registration/Login may be required to access all resource tools.] Introduces students to binomial probability distribution.
Other
West Virginia University: Normal Distribution
The history of the normal curve and its use in statistics is presented. An Applet is provided for the user to adjust the left and right edges of the probability and see the effect on the area under the curve.
Texas Instruments
Texas Instruments: Normal Distribution
This set contains statistics questions regarding the normal curve, its distribution, and its applications. The student, using the correct calculation, transitions between observed x-values, standard z-scores, and normal curve areas.
Texas Instruments
Texas Instruments: The Normal Distribution
Students graph normal distributions, shade desired areas, and find related probabilities. They graph Normal probability scatter plots to check the normal (linear) shape of a data distribution.
Other
Vlps: Mean and Standard Deviation
Explanation of frequency distributions, mean, standard deviations, and variance including a Java Applet.
Michigan Technological University
Computing Mean, Variance and Standard Deviation
Page centered around a computer program to determine mean, variance, and standard deviation.
Wolfram Research
Wolfram Math World: Correlation Coefficient
MathWorld offers a technical, yet informative, explanation of the correlation coefficient for bivariate normal distribution.
Yale University
Yale University: Probability Models
A general description of probability, probability rules, and Venn diagrams.
Math Planet
Math Planet: Algebra 2: Standard Deviation and Normal Distribution
Gain an understanding of standard deviation and normal distribution by viewing an example and a video lesson.
Khan Academy
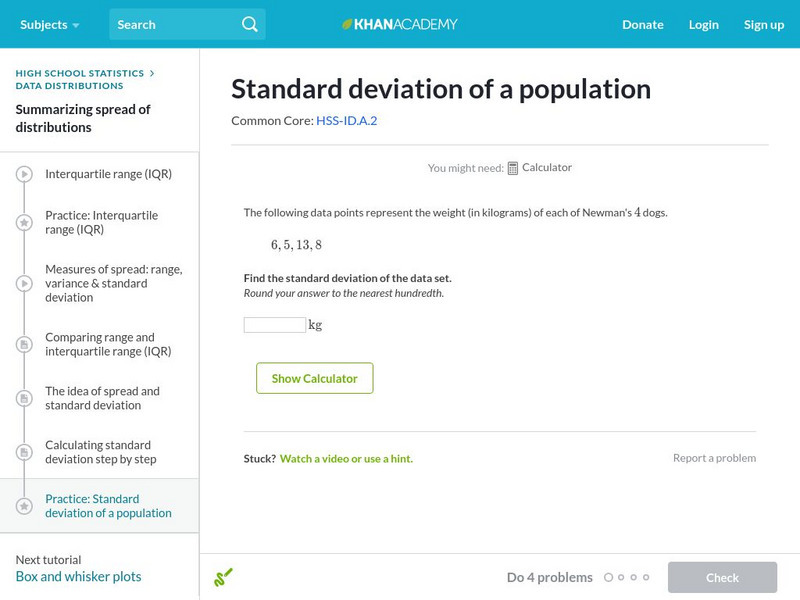
Khan Academy: Standard Deviation of a Population
Calculate the standard deviation of a population. Students receive immediate feedback and have the opportunity to try questions repeatedly, watch a video or receive hints.
Khan Academy
Khan Academy: Expected Value With Calculated Probabilities
Find expected value based on calculated probabilities. Students receive immediate feedback and have the opportunity to try questions repeatedly, watch a video or receive hints.
Khan Academy
Khan Academy: Discrete Random Variables: Expected Value
Compute the expected value given a set of outcomes, probabilities, and payoffs. Students receive immediate feedback and have the opportunity to try questions repeatedly or receive hints.
University of Illinois
University of Illinois: Mste: How Much Do Baseball Players Really Make?
An interesting real-world use of statistical variance and standard deviation to help dispell the common perception that all major league baseball players are paid millions of dollars and are not worth it. The lesson plan gives specific...
Illustrative Mathematics
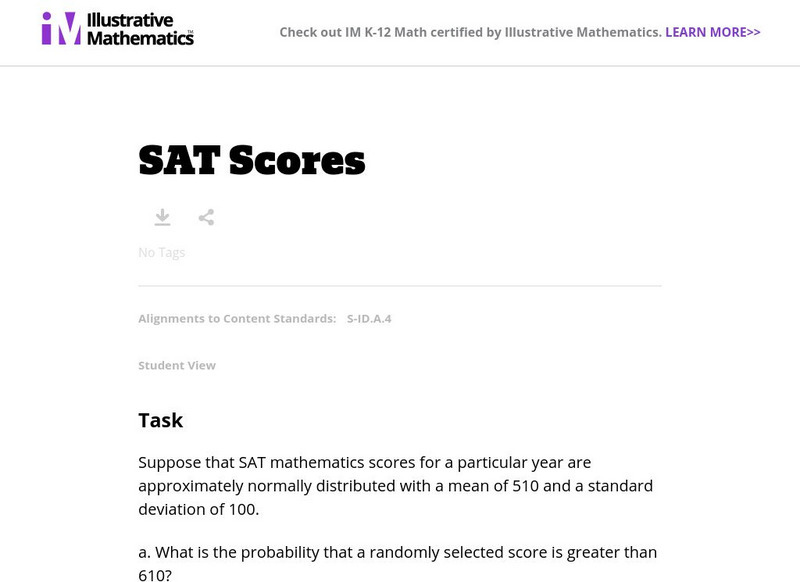
Illustrative Mathematics: S Id Sat Scores
Students will find solutions for a series of questions based on the assumption that SAT mathematics scores for a particular year are approximately normally distributed with a mean of 510 and a standard deviation of 100. Explanation and...
Illustrative Mathematics
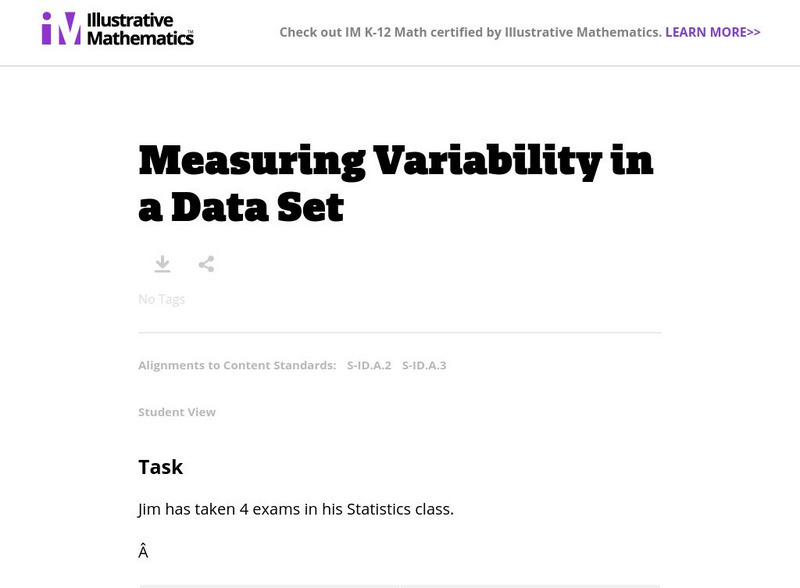
Illustrative Mathematics: Measuring Variability in a Data Set
The purpose of this student task is to develop understanding of standard deviation. Aligns with S-ID.A.2 and S-ID.A.3.
Other
Magoosh: Statistics Fundamentals
An online course on the fundamentals of statistics including video lessons in Mean, Median, and Mode; Weighted Averages; Quartiles and Boxplots; Range and Standard Deviation; Normal Distribution; Z-scores; Intro to Inferential...


