Rice University
Introductory Statistics
Statistically speaking, the content covers several grades. Featuring all of the statistics typically covered in a college-level Statistics course, the expansive content spans from sixth grade on up to high school. Material...
101 Questions
100-Hand Video Poker
You hit the jackpot with a fun lesson! Peak your pupils' interest with a lesson calculating the probability of poker hands. A video shows the different types of possible hands when given a specific hand and one card to draw.
National Council of Teachers of Mathematics
Cash or Gas?
Which option provides the best payout? Pupils predict which lottery prize to take. They devise a method to calculate which prize would likely provide the greatest monetary value.
EngageNY
Games of Chance and Expected Value 2
Use expected values to analyze games of chance. The 15th installment of a 21-part module has young mathematicians looking at different games involving tickets and deciding which would be the best to play. They calculate expected payoffs...
Massachusetts Institute of Technology
Mit: Open Course Ware: Introduction to Probability and Statistics
The online course consists of educational materials about probability and statistics. Lecture notes, exams, and assignments are included.
Wolfram Research
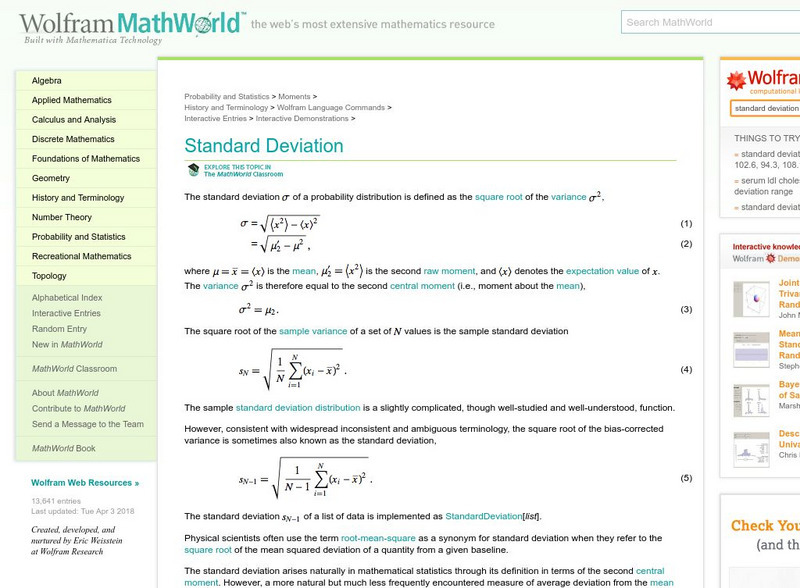
Wolfram Math World: Standard Deviation
This World of Mathematics site by Eric Weisstein explains the term "Standard deviation." Provides step-by-step help, examples, and charts.
University of Colorado
University of Colorado: Ph Et Interactive Simulations: Plinko Probability
Play Plinko and develop your knowledge of statistics. Drops balls through a triangular grid of pegs and see the balls random walk through the lattice. Watch the histogram of final positions build up and approach the binomial distribution.
Rice University
Hyper Stat Online Statistics Textbook: Trend Analysis
A series of pages that help us understand testing one or more components of a trend using specific comparisons, a set of coefficients, error analysis of variance and the probability value.
University of Colorado
University of Colorado: Ph Et Interactive Simulations: Plinko Probability
Drop balls through a triangular grid of pegs and see them accumulate in containers. Switch to a histogram view and compare the distribution of balls to an ideal binomial distribution. Adjust the binomial probability and develop your...
Other
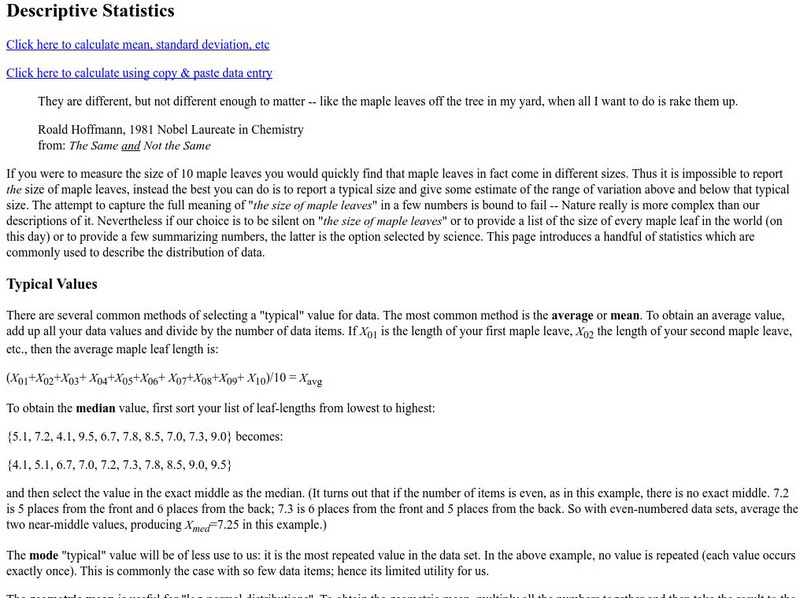
Descriptive Statistics
Very complete explanation of mean, standard deviation, etc. including an online calcluator for these statistics.
Google
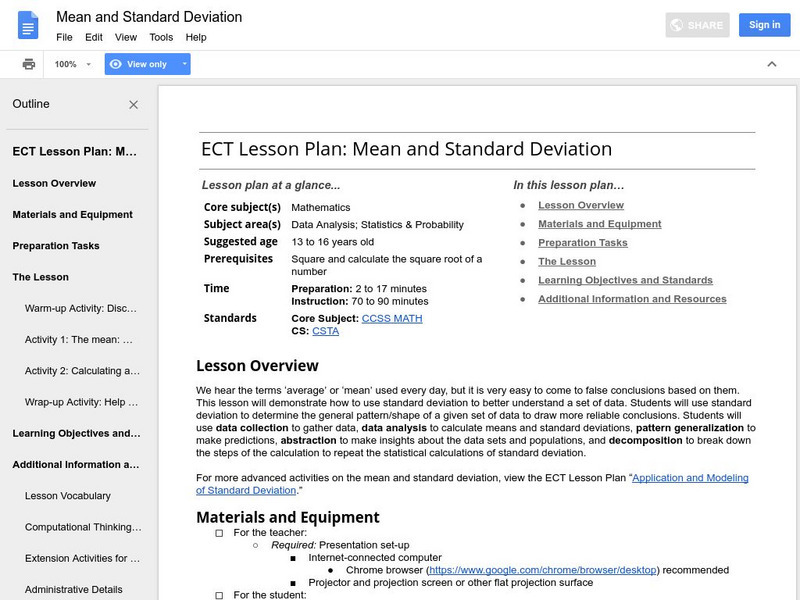
Google for Education: Mean and Standard Deviation
This lesson demonstrates to young scholars how to use standard deviation to better understand a set of data. Students use standard deviation to determine the general pattern or shape of a given set of data to draw more reliable conclusions.
Texas Instruments
Texas Instruments: Numb3 Rs: Expected Value
Based off of the hit television show NUMB3RS, this lesson attempts to explain the betting system at horse tracks by having learners vie for parcels of land on their calculators. Because the land boundaries are unknown until the finale of...
Vision Learning
Visionlearning: Statistics: Using Mean, Median, and Standard Deviation
An introduction to recognizing trends and relationships in data through descriptive statistics.
Missouri State University
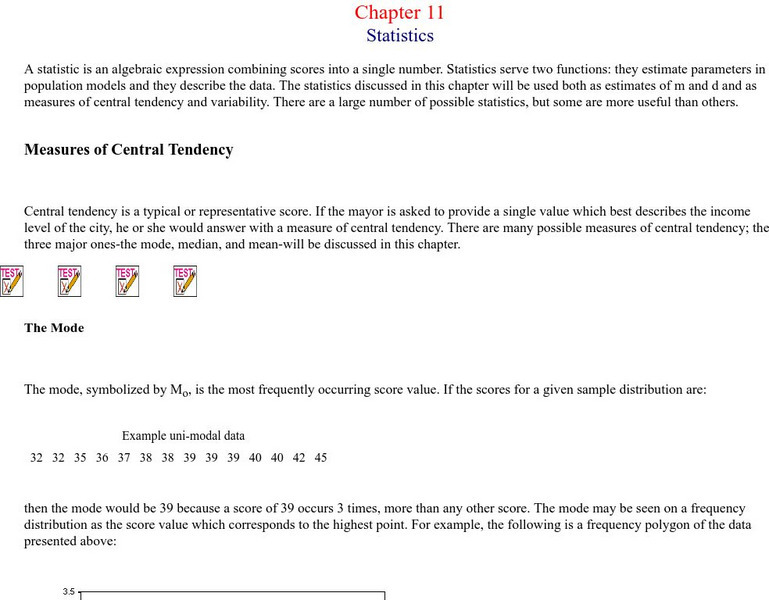
Missouri State U.: Statistics: Measures of Central Tendency and Variability
Provides lengthy explanations of the measures of central tendency - mean, mode, and median - and the measures of variability - range, variance, standard deviation. Graphs of interesting examples are presented as well, skewed...
Columbia University
Columbia University: Expected Value Pdf
A PDF explaining and giving examples to show how the expected value of a random variable indicates its weighted average.
City University of New York
Measures of Variability
Explanation and examples of variance and standard deviation. Helpful charts and formulas are provided.
Wolfram Research
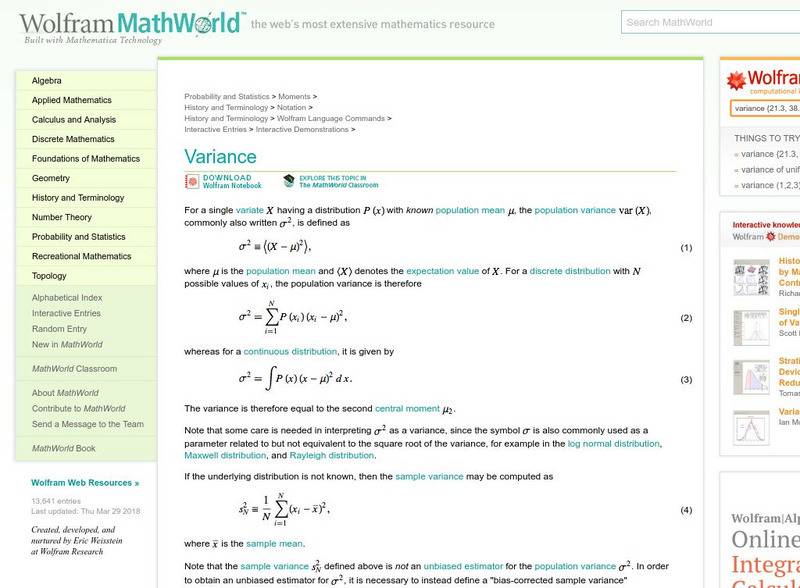
Wolfram Math World: Variance
MathWorld offers a plethora of information on variance. Student should have some statistic knowledge to use this site. This site contains links to related topics.
National Council of Teachers of Mathematics
The Math Forum: Probability and Statistics
This page is a math home page that includes information on all topics of probability and statistics.
Texas Instruments
Texas Instruments: Binomial Distribution
Questions cover the binomial distribution. Students identify characteristics of a binomial distribution and calculate probabilities for different ranges. Binomial mean and variance are covered in the link between the binomial and normal...
Texas Instruments
Texas Instruments: How Close Is Close?
In this activity, students compute statistical measures like the mean, standard deviation, and variance of the data set. They understand how measures of variability can be interpreted.
Texas Instruments
Texas Instruments: Analyzing Variance (Anova)
Students analyze variances of various data samples.
Texas Instruments
Texas Instruments: One Way Analysis of Variance
This set contains questions about statistics regarding the one-way analysis of variance (ANOVA). The student learns to develop hypotheses, find the test statistic, and reach a conclusion in the context of the original problem.
Texas Instruments
Texas Instruments: Probability as Relative Frequency
In this activity, students use simulation to justify the concept of the Law of Large Numbers. They understand that as the sample size increases, the relative frequency of which an event occurs approaches the probability of that event...
Texas Instruments
Texas Instruments: Means & Variances of Random Variables
This set contains statistics questions regarding means and variances of random variables. The student calculates sums and differences of random variables based on their means and variances.


