Stefan Warner and Steven R. Costenoble
Finite Mathematics & Applied Calculus: Histogram and Probability Distribution Generator
The learning tool displays data in the form of a histogram. The tool also shows descriptive statistics and probability distributions. Examples of data are included.
Stefan Warner and Steven R. Costenoble
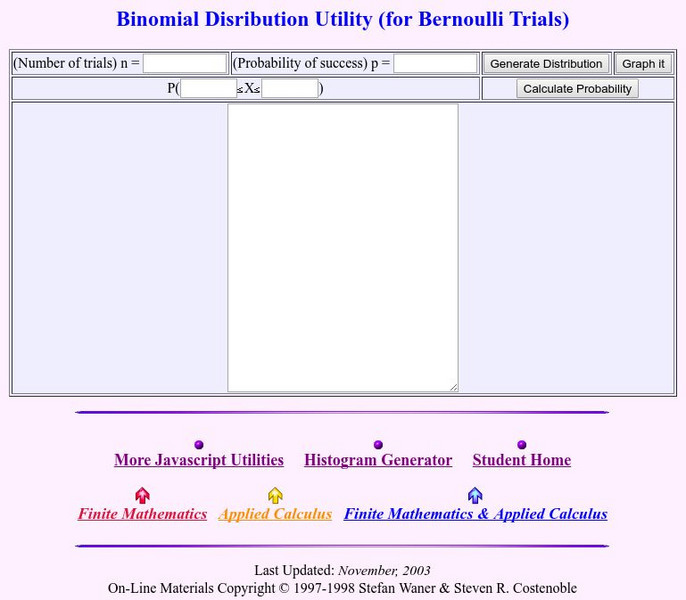
Finite Mathematics & Applied Calculus: Binomial Distribution Utility
The learning tool calculates the probability of a binomial distribution.
Stefan Warner and Steven R. Costenoble
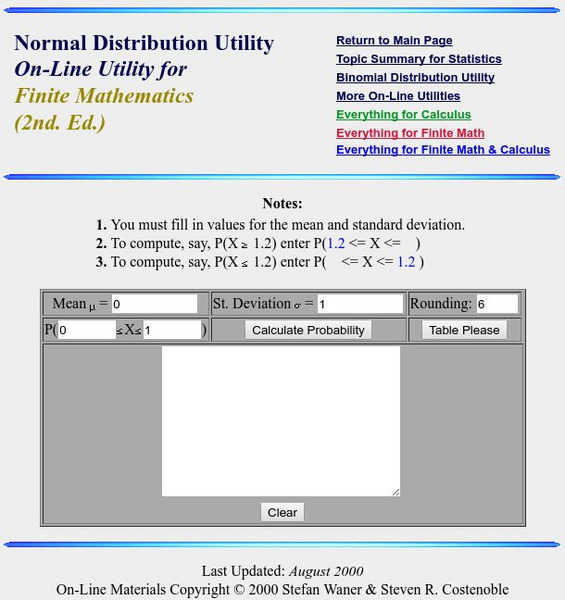
Finite Mathematics & Applied Calculus: Normal Distribution Utility
The learning tool calculates the probability of a normal distribution.
Shmoop University
Shmoop: Basic Statistics & Probability: Factorials
The probability resource investigates factorials. Students learn about the topic through notes and examples. The tutorial consists of practice exercises to check for comprehension of the concept.
National Council of Teachers of Mathematics
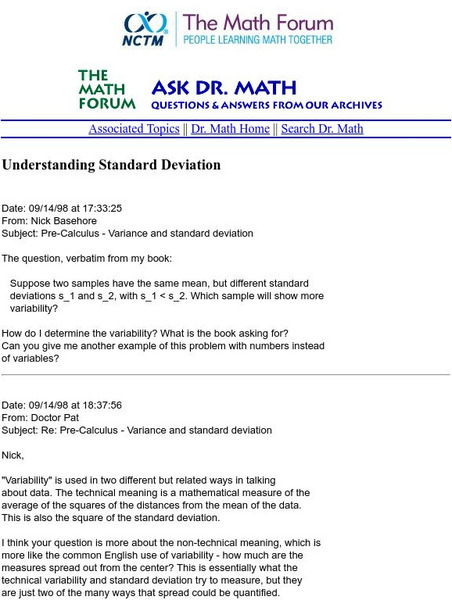
The Math Forum: Understanding Standard Deviation
MathForum answers a question on variance and standard deviation.
Other
Meta Calculator: Statistics Calculator
A web-based statistics calculator to find mean, median, standard deviation, variance and ranges.
BBC
Bbc: Standard Deviation
A demonstration of how to find the standard deviation of a set of data. Several examples and a practice test are offered.
Interactive Mathematics
Interactive Mathematics: Binomial Distribution
The definition and properties of binomial distributions are presented here, along with the formulas for finding the mean and variance. Examples are provided to demonstrate how binomial distribution problems are solved.
University of Glasgow
Steps Statistics Glossary: Sampling Distribution
This site provides an overview of sampling distribution and associated terms.
University of Glasgow
Steps Statistics Glossary: Random Variables and Probability Distributions
This section of the Statistics Glossary offers definitions of terms having to do with random variables and probability distributions such as expected value and normal distribution.
Calculator Soup
Calculator Soup: Standard Deviation Calculator
Standard deviation is a statistical measure of diversity or variability in a data set. A low standard deviation indicates that data points are generally close to the mean or the average value. A high standard deviation indicates greater...
Calculator Soup
Calculator Soup: Statistics Calculator
Calculate basic summary statistics for a sample or population data set including minimum, maximum, range, sum, count, mean, median, mode, standard deviation and variance.
Calculator Soup
Calculator Soup: Variance Calculator
Variance is a measure of dispersion of data points from the mean. Low variance indicates that data points are generally similar and do not vary widely from the mean. High variance indicates that data values have greater variability and...
Other
Berrie's Statistics Page: Normal Distribution
Site discusses the normal distribution as well as the mean and variance in the normal distribution. A link is provided for a QuickTime activity to adjust the mean.
University of Glasgow
Steps Statistics Glossary: Sample Mean
The definition of a sample mean is provided along with the symbol commonly used for it and an example to show the formula in action. A link to "expected value" - a related topic - is provided.


