Curated OER
Chart the Weather for Cities Around the World
Students orally describe Northern and Southern hemispheres, identify 7 continents, and point out specific countries and cities. They locate and record weather information.
Curated OER
FILLING IN THE GAPS - Acquiring and Analyzing Satellite and Ground-Based Data
Students monitor rainfall, compute daily averages, and compare their methods of computation to those used by actual researchers using satellite observations.
Curated OER
Ketchup to Collecting Data
First graders collect data for a survey of 3 brands of ketchup and create class charts. They taste test three different brands of ketchup, and use the data to create a presentation. Tasty lesson!
Curated OER
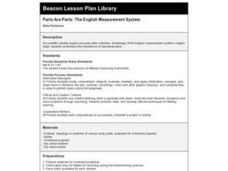
Parts Are Parts: The English Measurement System
Third graders view and measure common body parts to find a fathom, a span, and inch. They discuss the historical information about how standard English measurements came to be and why body parts can no longer be used as a standard...
Curated OER
Closing the Case
Fifth graders collect data and prepare data displays using a survey with statistical information.
Curated OER
Follow Spring's Journey North Recording Highlights of the Season
Students scan headlines on the Journey North News Updates each day to track the changes that spring brings as it comes to different areas of the United States.
Curated OER
Laboratory - Density of a Material
Students conduct a lab (with water, guar gum and sodium borate) and carefully record physical and chemical properties and changes throughout the session, and experiment with weighing by difference.
Curated OER
Walking the Plank
Eighth graders experiment with a bathroom scale, books and a plank to determine how weight readings change as distance is applied. They graph and interpret the results.
Curated OER
Raisin Cane
Learners estimate and record the number of raisins in a snack-size box. They also graph their results and note the differences (+ or -) from their estimate and actual number.
Curated OER
Viewing Tubes
Middle schoolers complete a lab in order to discover if the length of a viewing tube, its diameter, or the distance from an object affect the type of data collected and the resulting graph.
Curated OER
Bubbles
Third graders perform an experiment using different mixtures of dishwasher detergent. They construct bar graphs that record their bubble data for each detergent set.
NOAA
Noaa: Tide and Current Glossary [Pdf]
This site offers definitions of the many and varied terms used to describe tides and currents.
Cornell University
Cornell University: Roper Center for Public Opinion Research
This site is useful because it offers a database of over 300,000 questions asked on surveys since the 1930s. Also contains Latin American and Japanese data bank retrieval system as well. Listing of general social surveys 1972-1998.
PBS
Pbs Learning Media: Harry's Allergy
Harry keeps track of the number of times he sneezes in certain locations to try to diagnose the cause of his allergy in this video segment from Cyberchase.
PBS
Pbs Learning Media: A Flooding Threat
In this video segment from Cyberchase, the CyberSquad uses a graph to estimate how much the water level will rise in the Sensible Flats reservoir.
PBS
Pbs Learning Media: Using Data Clusters to Find Hacker
The CyberSquad searches for Hacker's castle based on a survey of where town residents have last seen him in this video from Cyberchase.
PBS
Pbs Learning Media: Restocking Shoes
In this video from Cyberchase, Bianca uses data on past shoe sales to help her decide what quantities of each size she should order in the next shipment.
Science Buddies
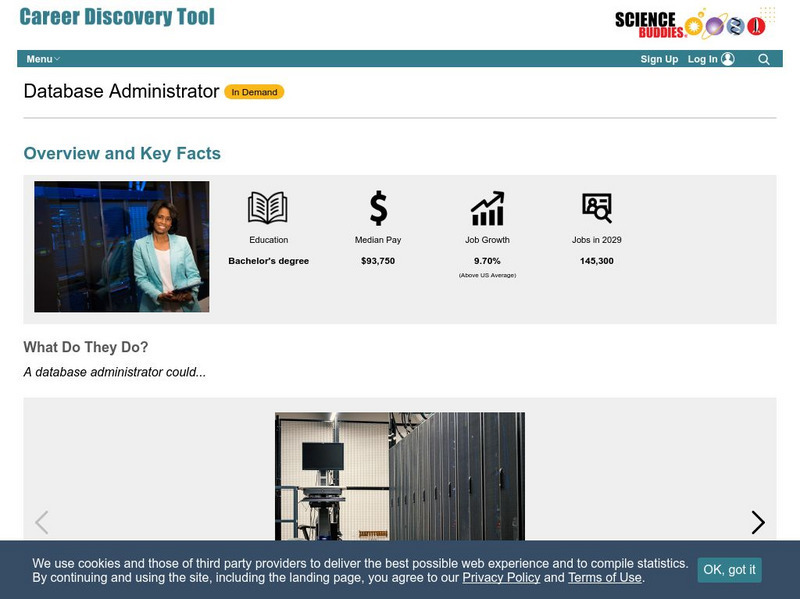
Science Buddies: Career Profile: Database Administrator
With so much data gathered on the computer, someone needs to be able to organize it. That falls to the database administrator. This Science Buddies site lays out the requirements needed to become a database administrator , as well as the...
Science Buddies
Science Buddies: An Experiment in Visual Perception
Graphical methods of data presentation are a key feature of scientific communication. This project will get you thinking about how to find the best way to communicate scientific information.
University of Texas
Inside Mathematics: Our Pets [Pdf]
This task challenges a student to demonstrate understanding of concepts involved in representing and interpreting data.
University of Texas
Inside Mathematics: Parking Cars [Pdf]
This task challenges a student to use their understanding of scale to read and interpret data in a bar graph.
University of Texas
Inside Mathematics: Granny's Balloon Trip [Pdf]
This task challenges a student to use knowledge of scale to organize and represent data from a table on a graph.
US Geological Survey
Bismuth
A listing of all sorts of available reports on bismuth. Great resources for students at many levels.
NOAA
Noaa: National Ocean Service: Tides Online
Coast to coast tide data. Links to state and storm information, historical data and frequently asked questions all about tides.


![Noaa: Tide and Current Glossary [Pdf] Website Noaa: Tide and Current Glossary [Pdf] Website](https://d15y2dacu3jp90.cloudfront.net/images/attachment_defaults/resource/large/FPO-knovation.png)


