Mind Tools
Introducation to Communication Skills
This article reveals the purpose of communication: to get your message across to others. This may seem elementary, but the process that involves both the sender of the message and the receiver is complex and can lead to confusion and...
CK-12 Foundation
Ck 12: Earth Science : Scientific Explanations and Interpretations
[Free Registration/Login may be required to access all resource tools.] Presents the relationships of facts, explanations, and opinions in science.
CK-12 Foundation
Ck 12: Statistics: Bar Graphs Grade 7
[Free Registration/Login may be required to access all resource tools.] Make a bar graph to display given data.
CK-12 Foundation
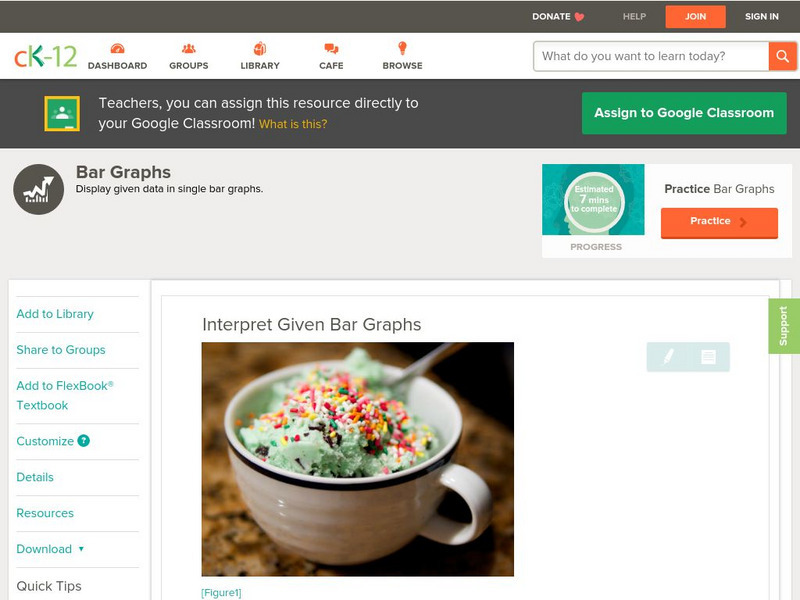
Ck 12: Statistics: Bar Graphs Grade 8
[Free Registration/Login may be required to access all resource tools.] Students will interpret data to understand given bar graphs.
CK-12 Foundation
Ck 12: Statistics: Circle Graphs to Display Data Grade 7
[Free Registration/Login may be required to access all resource tools.] Make circle graphs by using given data.
CK-12 Foundation
Ck 12: Frequency Tables to Organize and Display Data Grade 7
[Free Registration/Login may be required to access all resource tools.] Make a frequency table to organize and display data.
CK-12 Foundation
Ck 12: Statistics: Histograms Grade 7
[Free Registration/Login may be required to access all resource tools.] Make a histogram given a frequency table.
CK-12 Foundation
Ck 12: Statistics: Line Graphs Grade 7
[Free Registration/Login may be required to access all resource tools.] Make a line graph to display data over time.
CK-12 Foundation
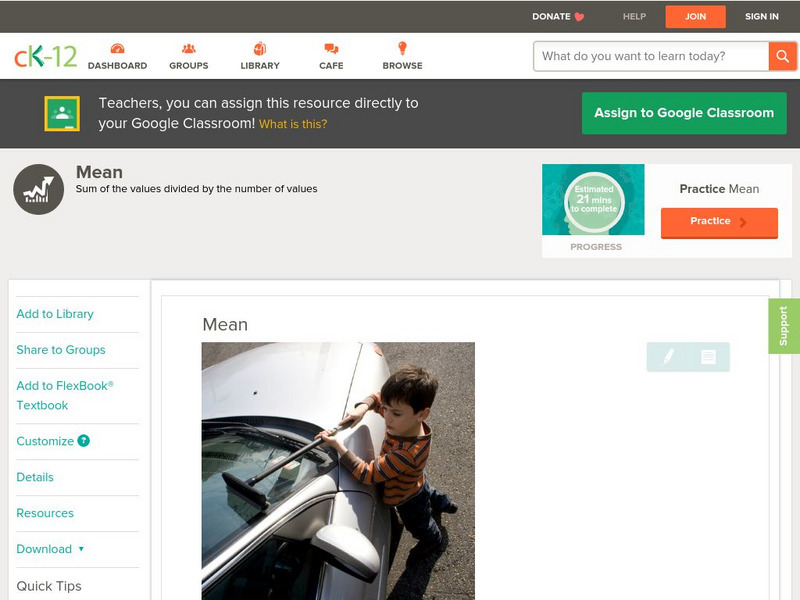
Ck 12: Statistics: Mean
[Free Registration/Login may be required to access all resource tools.] Find the mean of a set of data.
CK-12 Foundation
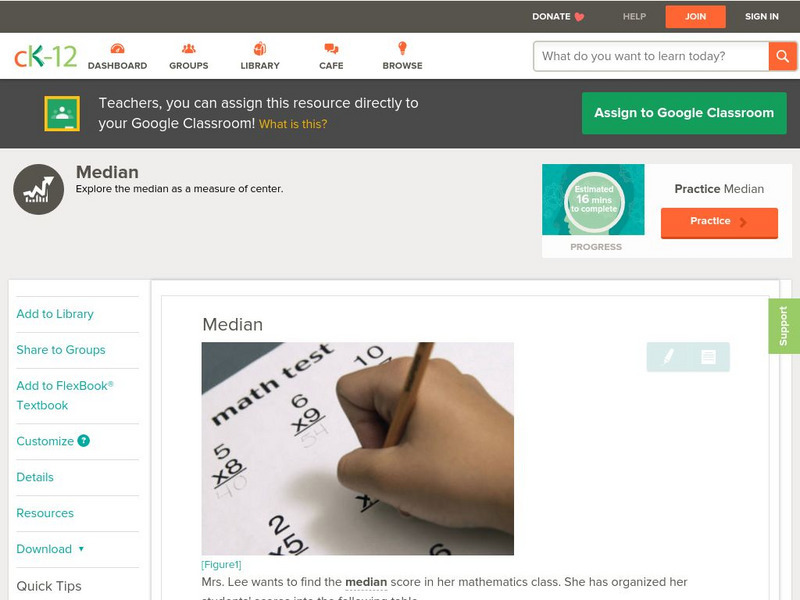
Ck 12: Statistics: Median Grade 7
[Free Registration/Login may be required to access all resource tools.] Find the median of a set of data.
CK-12 Foundation
Ck 12: Statistics: Mode Grade 7
[Free Registration/Login may be required to access all resource tools.] Find the mode of a set of data.
CK-12 Foundation
Ck 12: Statistics: Multiple Bar Graphs Grades 6 7
[Free Registration/Login may be required to access all resource tools.] Create multiple bar graphs to display and compare given data.
CK-12 Foundation
Ck 12: Statistics: Multiple Bar Graphs Grade 7
[Free Registration/Login may be required to access all resource tools.] Make multiple bar graphs to display and compare data.
CK-12 Foundation
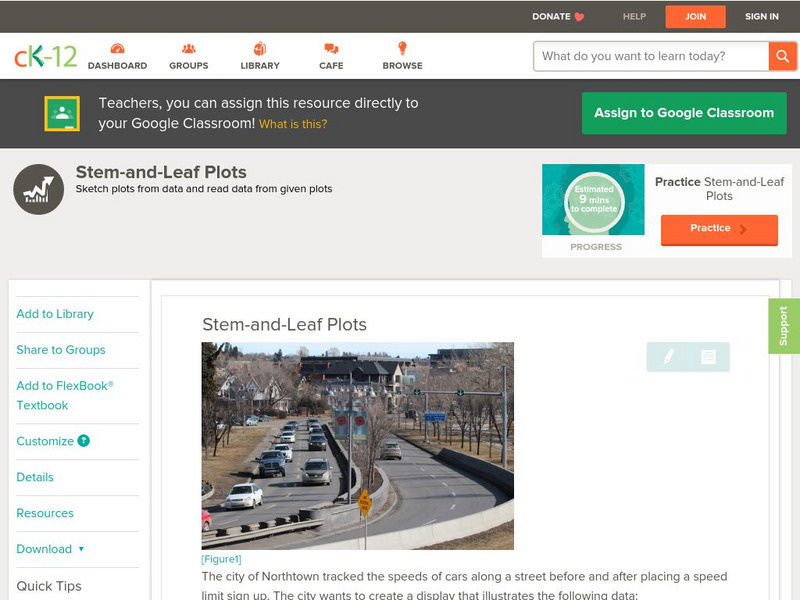
Ck 12: Statistics: Stem and Leaf Plots Grade 6
[Free Registration/Login may be required to access all resource tools.] Organize a given set of data in a stem-and-leaf plot.
American Geosciences Institute
American Geosciences Institute: Earth Science Week: Sky and Cloud Windows
In this activity, students will conduct experiments or participate in demonstrations to answer questions about sky and weather phenomena.
CPALMS
Florida State University Cpalms: Florida Students: Scientific Laws and Theories
Differentiate between scientific laws and theories. Identify examples of scientific theories and use evidence to support them.
Other
Maths Zone
A huge collection of math online games for all ages. Access different types of math such as: use and apply, count and understand, addition and subtraction number facts, multiplication and division number facts, shapes, measuring, and...
Cornell Lab of Ornithology
Habitat Network: The Great Backyard Bird Count Group
Show off a local wonderful habitat by joining the Great-Backyard-Bird-Count group, and put the bird count data on your map.
Discovery Education
Discovery Education: Web Math: Using a Number Line
This WebMath site provides an interactive number line "solver." Content includes helpful hint and a full explanation of the mathematical solution.
Read Works
Read Works:north America:comparing Data From Different Countries Around the World
[Free Registration/Login Required] A chart with land and population data from Canada, the United States of America, the United Kingdom, and Japan. A question sheet is available to help students build skills in reading comprehension.
CK-12 Foundation
Ck 12: Statistics: Stem and Leaf Plots, Range of a Data Set
[Free Registration/Login may be required to access all resource tools.] Find the range of a set of data displayed in a stem-and-leaf plot.
American Geosciences Institute
American Geosciences Institute: What Are Weather Observations?
Find out why meteorologists need weather observations to accurately measure and predict the weather.
Utah Education Network
Uen: 1st Grade Act. 04: Chrysanthemum and Letter Tiles
In this lesson plan, students will engage in shared reading with the Kevin Henkes' book, Chrysanthemum. Then students will engage in a letter tiles activity that requires them to compare the length of their own names with the name...
Utah Education Network
Uen: 1st Grade Act. 03: T Shirt Glyph
During this mini-unit, students will develop a t-shirt with a glyph that represents their own personalities. Then students will read the glyphs of others using a legend to understand the data on the glyphs.


