University of Massachusetts
University of Massachusetts: Rasmol & Chime
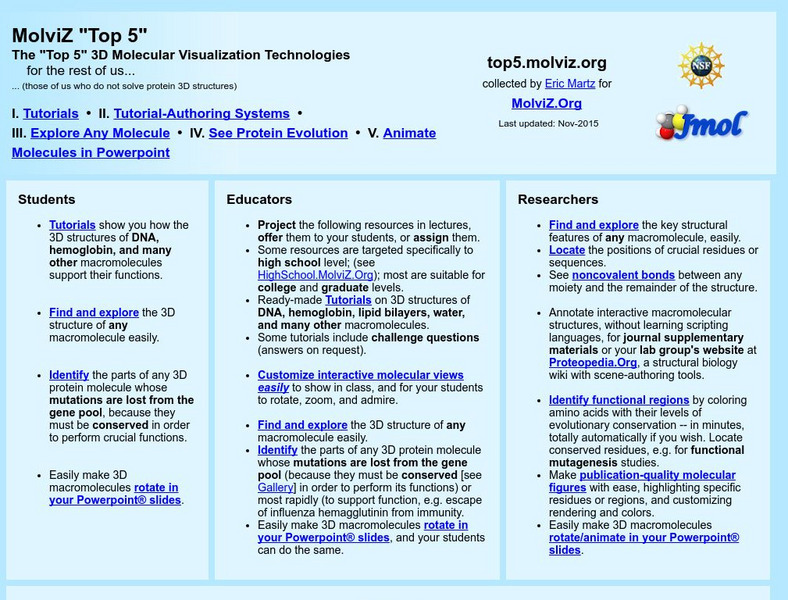
This site from the University of Massachusetts links to downloadable freeware (Rasmol and CHIME) which are required to view 3-D images common on organic chemistry tutorials.
Shodor Education Foundation
Shodor Interactivate: Lesson: Stem and Leaf Plots
Lesson plan introduces young scholars to stem-and-leaf plots. Many resources are available for student and teachers here.
Rice University
Hyper Stat Online Statistics Textbook: Population
A definition of "population" as it refers to statistics.
PBS
Pbs Teachers: In a Heartbeat [Pdf]
Apply knowledge of scatter plots to discover the correlation between heartbeats per minute before and after aerobic exercise.
Other
Drs.cavanaugh: Science proj.handbook, Display Checklist
A checklist of the nine or ten items which should be on your display, plus an illustration of where they should go on a tri-fold poster.
Instituto Latinoamericano de la Comunicacion Educativa
Red Escolar: Telar Del Pensamiento Matematico
In Spanish. Different mathematical topics are presented with questions and activities.
Sophia Learning
Sophia: Steps of the Scientific Method: Lesson 4
This lesson will explain the steps involved in the Scientific Method. It is 4 of 4 in the series titled "Steps of the Scientific Method."
Sophia Learning
Sophia: Steps of the Scientific Method: Lesson 1
This lesson will explain the steps involved in the Scientific Method. It is 1 of 4 in the series titled "Steps of the Scientific Method."
Sophia Learning
Sophia: Using Graphs to Analyze Data
This lesson will demonstrate how to analyze and interpret data given in the form of a graph.
Sophia Learning
Sophia: Why Collect Data: Lesson 2
This lesson will discuss and explain why we collect data. It is 2 of 5 in the series titled "Why Collect Data."
Sophia Learning
Sophia: Why Collect Data: Lesson 3
This lesson will discuss and explain why we collect data. It is 3 of 5 in the series titled "Why Collect Data."
Sophia Learning
Sophia: Why Collect Data: Lesson 5
This lesson will discuss and explain why we collect data. It is 5 of 5 in the series titled "Why Collect Data."
Sophia Learning
Sophia: Writing Stem and Leaf Plots #3
This lesson demonstrates how to write stem-and-leaf plots for a given set of data.
Sophia Learning
Sophia: Writing Stem and Leaf Plots #4
This lesson demonstrates how to write stem-and-leaf plots for a given set of data.
Illustrative Mathematics
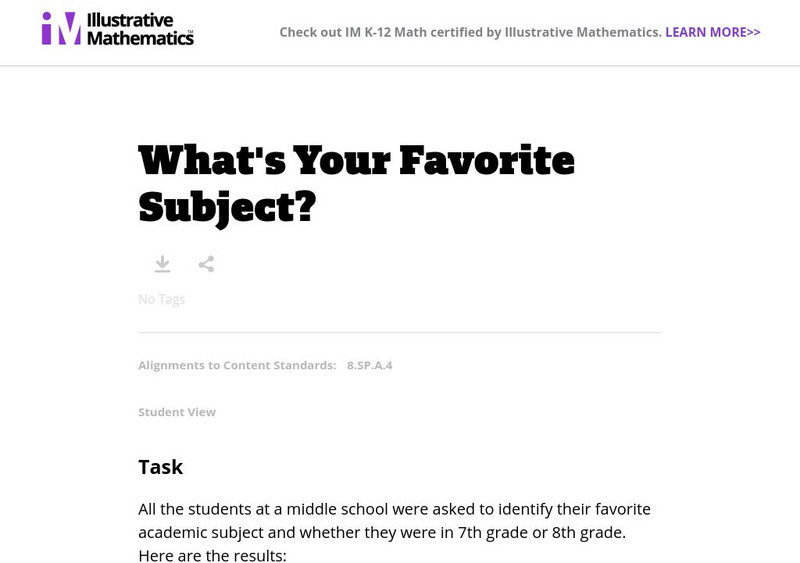
Illustrative Mathematics: What's Your Favorite Subject
This website provides a task in which students interpret data in a two way table by calculating the relative frequencies of a data set.
ClassFlow
Class Flow: Pictograph With Key Greater Than 1
[Free Registration/Login Required] This flipchart introduces reading a pictograph with a key greater than one, answering questions from data represented, find number of symbols to represent data by using a key, construct pictograph, and...
ClassFlow
Class Flow: Pie Charts Handling Data
[Free Registration/Login Required] Students read and interpret information presented in a pie chart and then determine percentages and ratios numerically and graphically.
ClassFlow
Class Flow: Probability Spinner Handling Data
[Free Registration/Login Required] Students construct a probability spinner and then test, graph and analyze their data.
ClassFlow
Class Flow: Probability Starter: Handling Data
[Free Registration/Login Required] Students are introduced to the concept of theoretical and actual probability in a variety of contexts.
ClassFlow
Class Flow: Scatter Graphs Handling Data
[Free Registration/Login Required] In this flipchart, students analyze a pattern, in the form of a scatter graph then judge the reasonableness of conclusions drawn from a set of data.
ClassFlow
Class Flow: Stem and Leaf Diagrams
[Free Registration/Login Required] In this flipchart, students develop an understanding of algebraic sense by recognizing sequences between sets of numbers and linear patterns. Students apply their understanding to recognize the formulas...
ClassFlow
Class Flow: Tally Table Lessons
[Free Registration/Login Required] This flipchart contains interactive pages to help students learn how to read and interpret tally tables. There are 7 different tally table pages with questions. There are some blank tables at the end of...



![Pbs Teachers: In a Heartbeat [Pdf] Lesson Plan Pbs Teachers: In a Heartbeat [Pdf] Lesson Plan](https://d15y2dacu3jp90.cloudfront.net/images/attachment_defaults/resource/large/FPO-knovation.png)

