Curated OER
Monstrous Data
Students examine the meaning of data and data collection, represent data in various ways, and make a bar graph.
Curated OER
Populations Lab - Cultures Lesson: Statistics / Sampling Patterns
Ninth graders examine the application of statistical sampling, data collection, analysis, and representation that exists in schooling and teenage lifestyles in Japan and the United States.
Alabama Learning Exchange
Yummy Apples!
Young learners listen to a read aloud of Gail Gibbons book, Apples and the story A Red House With No Windows and No Doors. They compare characteristics of a number of kinds of apples, graph them and create a apple print picture. Learners...
Curated OER
Bloodstain Pattern Simulations: A Physical Analysis
Students receive bloodstain pattern evidence from a crime scene. They answer a series of questions through inquiry, observation, measurement, and analysis. Pupils complete this challenge, by reconstructing the evidence through four...
Curated OER
Bird Ecology Unit
Birds, plants, and vegetation, is there anything more lovely? There is! Engage your class in the scientific process, data collection, and data analysis. They stroll their campus observing and identifying various birds and plants,...
Curated OER
That's Predictable - Stream Side Science
Research the impact that changes in biotic or abiotic factors might have on an ecosystem. Debate for or against the changes and take action in the community. This resource ideally follows stream studies that young ecologists may have...
Curated OER
Stream Consciousness
Actual stream water is analyzed in this environmental science activity. Participants measure water temperature and pH, and then survey the macroinvertebrates living in their samples. The data worksheet, troubleshooting tips, and...
Curated OER
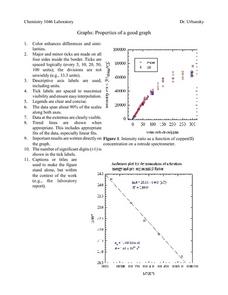
Properties of a Good Graph
For this chemistry worksheet, students examine the common characteristics of an acceptable graph that is meant to be used to display data.
Curated OER
The Golden Students
Scholars view the video, "Donald Duck in Mathmagic Land," and discuss examples in nature which have proportions of the golden ratio. They measure and record different body lengths from a worksheet and convert the ratios to equivalent...
Curated OER
A Day at the Beach
Help learners determine the rate of change for the temperature of sand. They will collect data on the temperature of wet and dry sand over time with a heat lamp overhead. Then make a scatter plot of the data and find a linear model to...
101 Questions
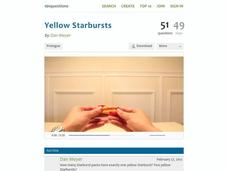
Yellow Starbursts
Let the task burst your mind. Scholars estimate the frequency that both Starbursts in a pack are yellow out of 287 packs. They apply probability concepts to complete the sweet task.
Scholastic
Study Jams! Investigations to Collect Data
Print out the lyrics or show the karaoke video to get your scientists singing about the scientific process! Participants will warble about observations and measurements, data and physical properties. Consider sharing this resource after...
Curated OER
Explore Surface Types on a Journey Around Earth
Young scholars explore satellite data. In this technology cross-curriculum math and world geography lesson, students locate specific map areas using a microset of satellite data. Young scholars use technology and math skills to determine...
Curated OER
Box and Whiskers
Middle schoolers discover how to relate collected data with a box and whiskers graph in a number of formats. They collect, organize, create, and interpret a box and whiskers graph. Pupils interpret the difference between sets of data,...
Curated OER
The Hot Dog Stand - An Annual Report
Students run a computer simulation and collect data as they work and use the data to create an annual report for their business. It is desirable for students to do this project individually, but it could be done as a class using a large...
Curated OER
What's Your Shoe Size? Linear Regression with MS Excel
Learners collect and analyze data. In this statistics lesson, pupils create a liner model of their data and analyze it using central tendencies. They find the linear regression using a spreadsheet.
Curated OER
The Way to Better Grades!
Pupils collect and analyze data. In this statistics lesson, learners create a scatter plot from their collected data. They use, tables and graphs to analyze the data and mae decisions.
Curated OER
Data Analysis: For Little Learners
Using pictographs, tally charts, and surveys, kids learn all about data analysis and collection. They make surveys, collect data, then construct pictographs and tally charts to organize their information.
Curated OER
Applied Science - Science and Math Pre-Lab 4C
Scholars classify the sciences. Using applied science, they compare and contrast subfields of sciences. They compare qualitative versus quatitative. They discuss types of sciences and the meanings of the word roots of the names.
Curated OER
Creating Tables and Bar Charts
A great way to introduce the concepts of data collection, bar charts, and data analysis. Learners see how their teacher used the data from fifty of her friends to construct a bar chart showing their favorite toys.
Curated OER
What Are Your Favorite Apples?
In this tally worksheet, students take a survey to determine the favorite apple. They write tally marks beside the apple chosen. For elementary students, this worksheet may be used for counting purposes and to reinforce what a tally mark...
Curated OER
Boomerang
Students explore the concept of boomerangs. For this boomerang lesson, students throw homemade boomerangs at different angles to record maximum distance and if it returned or not. Students collect their boomerang data then create a...
Curated OER
Make Your Own
Your first and second graders will categorize hearts, triangles, and stars, putting them in a picture graph. After the shapes are organized, they compare the number of each using the sentence frames provided.
Curated OER
Bungee Jump Lab
Student apply linear relationships to the real world. They use Ken and Barbie dolls and experiment to find the line of best fit. They collect data, analyze data, and make predictions from it. The learners also use Microsoft Power Point...


