Curated OER
Learning to Read Graphs 2
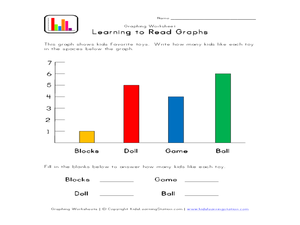
Do you like playing with blocks, dolls, games, or balls? Use this basic graph to review bar graphs with young learners. After completing the four questions below, consider creating your own class graph: who likes blocks the best? Who...
Curated OER
Learning to Read Graphs
What is your favorite pet? This is a great tool for youngsters just learning how to read and interpret graphs. There are four simple questions. Consider extending this activity by creating a class bar graph: how many learners have a dog,...
Curated OER
Data Displays with Excel
Students collect and analyze data. In this statistics lesson, students display their data using excel. They plot the data on a coordinate plane and draw conclusion from their data.
Curated OER
How Much Will Movies Cost In The Future?
Students use data collection and analysis, statistics, and probability in problem-solving situations and communicate the reasoning used in solving these problems.
Curated OER
WHAT IS THE POPULAR COLOR?
Fourth graders graph cars according to their colors. They complete the graph including a title, scale, x-axis, and y-axis. Students collect the data and choose the type of graph to be made.
Curated OER
Credit Cards: The Good, the Bad, and the ugly
Students study how dangerous credit cards can be. They see why it is important to pay off credit card bills as soon as they can. They use MS Excel to display and understand the data. They fill out questions using the data from their...
Curated OER
Graph Frenzy!!
Learners brainstorm for a survey question to ask classmates. They survey their classmates. They enter the results into a spreadsheet and create the best graph for the information. They share their graphs with the class.
Curated OER
kind of Bean
Third graders sort different types of beans and collect the data. They create a data table, put the information on the data table and then graph their results. They answer follow-up questions.
Curated OER
A Journey with a Scientist
Students work in groups as they read chapters of Charles Darwin's, Voyage of the Beagle. They take notes on the chapter and in their group make a timeline of the chapter. They tape the timelines together in order to depict the entire...
Curated OER
First Grade Shoe Sizes
Third graders collect shoe size data from classmates in their room and another third grade. They predict what the most common shoe size will be. They place the data in an spreadsheet on the computer. They design a graph using the...
Curated OER
Graphing Our Marbles
Students collect information pertaining to marble colors found in their bag; then creating a spreadsheet in order to make a chart representing their findings using Microsoft Excel. Students will present their results to small groups.
Curated OER
Light Stick Chemistry
In this descriptive investigation worksheet, 6th graders conduct an investigation to determine if heat energy affects the brightness of a light stick. The students will form a prediction, collect data and answer 3 conclusion questions.
Pennsylvania Department of Education
Use Order of Operations to Evaluate Expressions—No Grouping Symbols
Students identify and explain different types of data collection and graphs. For this graphs and data collection lesson, students record their observations of a variety of data collection tools and graphs displayed in the room. Students...
Curated OER
Probability- Based Bingo Lesson Plan
Statisticians play a game of Bingo to discover the meaning of probability. They are given 12 markers to distribute across the numbers 1-12 on their playing mat. As a pair of dice is rolled, markers are removed from the playing mat. The...
Pennsylvania Department of Education
Freckle Face
Students collect and record data. In this early data analysis lesson, students gather data about their partners face. As a class, the students use tally marks and pictographs to record the data and answer question about the information...
Curated OER
Teacher's Plant Collection Guide
Young scholars explore a variety of guidelines that involve collecting plants in a responsible manner and participate in a plant pressing activity. In this teacher's plant collection guide lesson, students collect data regarding plants,...
Curated OER
Ramp Builder
Students plan and build a ramp designed for maximum distance a car can travel. In this physics and data collection math lesson, students work in groups to design a ramp using various household materials. Students test small cars on their...
Curated OER
Fractile vs. Equal
Students compare and contrast methods of categorizing data. In this data collection lesson, students complete worksheet activities that require them to note the differences between equal and fractile intervals. Students also discuss...
Curated OER
Chocolate Preferences Voting and Graphing Techniques
Students practice sampling and graphing techniques. In this data collection and interpretation instructional activity, students write and conduct surveys about chocolate preferences and then collect their data. Students graph the data in...
Curated OER
Survival of the Fittest – Battling Beetles
Students explore natural selection. For this genetic adaptation lesson plan, students discover why certain traits continue and some traits disappear. Students discover how species evolve and change. Resources are provided.
Curated OER
The "Heart" of the Problem
Students explore mathematical operations while studying nutrition. For this physical fitness lesson, students explore calories, pulse rate, and the circulatory system. Students use mathematical data to create a healthy physical fitness...
Curated OER
Model and Solve Algebraic Equations
Examine multiple ways to solve algebraic equations. Pupils will generate a problem solving strategy that addresses the prompt given by the teacher. They will then share their problem solving strategy with the class. Graphic organizers,...
Curated OER
Applied Science - Science and Math Post-Lab
Students explore optical illusions. In this Applied Science lesson, students view optical illusions and record the data of what they see. Students graph the data that they collect.
Curated OER
Growing a Lawn
Learners research plant growth. In this plant growth lesson, students explore the needs of plants. Learners compare and contrast grass and broadleaf plants and grow a miniature lawn in a cup of soil. Resources are provided.


