Teach Engineering
Fun with Air-Powered Pneumatics
How high did the ball go? Engineering teams build a working pneumatic system that launches a ball into the air. The teams vary the amount of pressure and determine the accompanying height of the ball. An extension of building a device to...
EngageNY
Mid-Module Assessment Task - Algebra 1 (module 2)
A mid-module assessment uses two multi-part questions to measure progress toward mastery on descriptive statistics standards. Each part of a question addresses a single standard to help determine mastery.
Teach Engineering
Light vs. Heat Bulbs
Careful, that light bulb is hot! Compare heat and light energy using a simple light bulb. The exercise addresses energy conservation and presents actual calculations to determine the most cost-effective light bulb.
Fort Bend Independent School District
Data Analysis - AP Statistics
What better way to study survey design than to design your own survey! Bring a versatile data analysis project to your AP Statistics class, and encourage them to apply the practices from their instructions to a real-world survey project.
EngageNY
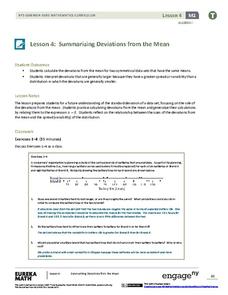
Summarizing Deviations from the Mean
Through a series of problems, learners determine the variability of a data set by looking at the deviations from the mean. Estimating means of larger data sets presented in histograms and providing a way to calculate an estimate round...
EngageNY
Relationships Between Two Numerical Variables
Working in small groups and in pairs, classmates build an understanding of what types of relationships can be used to model individual scatter plots. The nonlinear scatter plots in this lesson on relationships between two numerical...
EngageNY
Interpreting the Standard Deviation
Does standard deviation work for non-symmetrical distributions, and what does it mean? Through the use of examples, high schoolers determine the standard deviation of a variety of distributions and interpret its meaning. Problems require...
EngageNY
Describing the Center of a Distribution
So the mean is not always the best center? By working through this exploratory activity, the class comes to realize that depending upon the shape of a distribution, different centers should be chosen. Learners continue to explore the...
EngageNY
End-of-Module Assessment Task - Algebra 1 (Module 2)
Check for understanding at the end of your descriptive statistics unit with an end-of-module assessment. It uses five questions to measure progress toward mastery of descriptive statistics standards. Each question is developed to address...
EngageNY
Analyzing Residuals (Part 2)
Learn about patterns in residual plots with an informative math activity. Two examples make connections between the appearance of a residual plot and whether a linear model is the best model apparent. The problem set and exit ticket...
EngageNY
Analyzing Residuals (Part 1)
Just how far off is the least squares line? Using a graphing calculator, individuals or pairs create residual plots in order to determine how well a best fit line models data. Three examples walk through the calculator procedure of...
National External Diploma Program Council
Finding an Average
Young hopefuls can practice finding the average of a group of numbers represented in tables and word problems.
Curated OER
Drive the Data Derby
Three days of race car design and driving through the classroom while guessing probability could be a third graders dream. Learn to record car speed, distances traveled, and statistics by using calculation ranges using the mean, median,...
Have Fun Teaching
Scientific Method
Encourage your students' inner scientist by conducting experiments and recording their findings. This printable incorporates every part of the scientific method into an easy-to-read outline of experimental questions, research,...
Math Worksheets Land
Pie or Circle Graphs—Step-by-Step Lesson
How do you display data that you've collected in a pie chart? Follow a clear step-by-step guide to turning survey results into a visible format. It shows kids how to determine the percentage of the whole that each section represents.
Houghton Mifflin Harcourt
Zombie Ants
One of the creepiest and coolest natural occurrences is a great forum for data analysis and discussion! Explore the phenomenon of zombie ants, or ants infected with the Cordyceps fungus, with a series of activities and experiments. Kids...
Laying the Foundation
Box-and-Whisker Plots
Statistics is made approachable, and dare we say fun, in this activity on using box-and-whisker plots to analyze and compare data sets. Specific emphasis is placed on interpretations and explanations while graphing, and in using the...
Curated OER
Word Problem Practice Workbook
Need worksheets that challenge your middle schoolers to apply their understanding of math? Problem solved! From integers, fractions, and percents, to algebra, geometry, and probability, over 100 pages of word problem worksheets are...
Curated OER
Describing Data
Your learners will practice many ways of describing data using coordinate algebra in this unit written to address many Common Core State Standards. Simple examples of different ways to organize data are shared and then practice problems...
Mathematics Vision Project
Module 8: Modeling Data
Statistics come front and center in this unit all about analyzing discrete data. Real-world situations yield data sets that the class then uses to tease out connections and conclusions. Beginning with the basic histogram and...
Math Moves U
Collecting and Working with Data
Add to your collection of math resources with this extensive series of data analysis worksheets. Whether your teaching how to use frequency tables and tally charts to collect and organize data, or introducing young mathematicians to pie...
Jude Mphoweh
Graphs
Searching for worksheets to include in an elementary math series on bar graphs? Then look no further! This collection of materials has exactly what you need to ensure that your students get plenty of practice reading and analyzing the...
Georgia Department of Education
Math Class
Young analysts use real (provided) data from a class's test scores to practice using statistical tools. Not only do learners calculate measures of center and spread (including mean, median, deviation, and IQ range), but also use this...
K12 Reader
Displaying Data
It's important to learn how to display data to make the information easier for people to understand. A reading activity prompts kids to use context clues to answer five comprehension questions after reading several paragraphs about...


