Curated OER
Air Quality
Students observe air quality and monoxide data. In this air quality lesson, students draw conclusions and manipulate data from a one year period on changes in air quality.
Curated OER
Sending Messages to Space
Young scholars interpret a message sent to space using a radio telescope and draw inferences from the interpreted message. Working with a partner, they interpret data that scientists believe is a message from aliens. They work on...
Curated OER
Market Failures
Market failure and the effects it has in terms of social benefit is the focus of this eight-page packet. Perfect for homework, this set of excellent worksheets provides several scenarios and graphs that show positive and negative...
Curated OER
Rockefeller's Revenge: Exxon and Mobil Unite
Study the impact and possible outcomes of the Exxon-Mobil merger in your language arts, social studies, or economics class. Secondary learners evaluate a series of graphs, write a paragraph interpreting the data, and engage in class...
Curated OER
Redistricting: Drawing the Lines
Difficult redistricting concepts are covered in a context that will make it understandable to your government scholars. They begin with a KWL on the term redistricting and then watch a video to answer some questions. They analyze...
Curated OER
Dance Challenge: Calculate and Compare Speed by Measuring a Series of Dance Movements
Really neat! Kids choreograph a dance phrase and then measure the distance and speed of the phrase using a timer and a meter stick. They collect the data on a table which they use to determine an average. A series of observation and...
Curated OER
Walking the Plank
This is a cool math activity. Kids collect and interpret data based on a physical act. A board is balanced between a scale and a step, learners record a peer's weight as it decreases while s/he walks further away from the scale. They...
Curated OER
Lesson 9: Tracking Commodities
Over the corse of a month, small groups will monitor the price of a specific energy commodity and analyze it in relation to global and domestic events. They play a trade simulation game and create infographics showing what they've...
Curated OER
CSI Interdisciplinary Projects
Work across content areas with an engaging project that highlights higher-level thinking, teamwork, and a STEM focus.
Curated OER
Monster Data
An inventive lesson shows learners how to collect, organize, and present mathematical data. They access websites which lead them through a variety of ways to engage in data collection. They get to design and create graphs, and present...
Curated OER
To Recycle, or Not Recycle?
To recycle or not to recycle, that is the question. Your class can find the answer by taking a teacher created WebQuest, where they assume a role of a community member taking a stand on implementing a community wide recycling plan. The...
Curated OER
Data Analysis Using Technology
Analyze data using technology. Middle schoolers design data investigations, describe data, and draw their own conclusions. Then they select the best type of graph, graph and interpret the data, and look for patterns in trends. They also...
Curated OER
Accidents Happen: Seat Belt Laws, Enforcement, and Usage
Start with a NOVA video about car crashes, crash test dummy footage, or other video about seat belt use. Or have groups review attached data about seat belt usage (by state) and share their conclusions. Learners then devise a method to...
Curated OER
Galluping Away
Pupils use Gallop Poll results to explore causes and effects of the concerns of Americans in the past. They administer a similar poll and consider what Americans in their community view as the most pressing problems in the United States...
Curated OER
Building Brilliant Bar Graphs
Everything you need for a mini-unit on bar graphs is included in this lesson plan! It outlines three lessons and includes worksheets. Learners taste pretzels, shoot baskets (switching off hands), and grab candy, graphing results...
Curated OER
Opinion Poll-arities
Learners explore the mathematics behind opinion polls, as well as provides a framework for interpreting trends in opinion poll graphics.
Curated OER
Big Dam Construction in India
This complete and full resource includes everything needed to conduct a lesson on the environmental impact of large dams in India. Background information, handouts, answer keys, and web links are all there to help you educate your class...
Curated OER
Wacky Water World: Student Worksheet
This well-designed math worksheet invites learners to work in pairs in order to determine which plan is the better value when going to an amusement park. Plan A and Plan B each have different admission fees, and different rates per ride....
Curated OER
The Southeast Anatolia Project
This resource is amazing. It is a full project including teacher notes, handouts, procedure, and worksheets. It introduces learners to the GAP project, a social environmental group working to bring irrigation, assistance, and increased...
Curated OER
Ornithology and Real World Science
Double click that mouse because you just found an amazing lesson! This cross-curricular Ornithology lesson incorporates literature, writing, reading informational text, data collection, scientific inquiry, Internet research, art, and...
Curated OER
What Do Maps Show?
This teaching packet is for grades five through eight, and it is organized around geographic themes: location, place, relationships, movement, and regions. There are four full lessons that are complete with posters, weblinks, and...
Curated OER
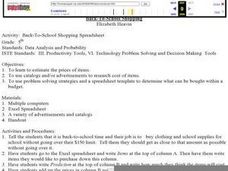
Back-To-School Shopping
Fifth graders estimate the prices of items to be bought for back to school. They use catalogs and/or advertisements to research the cost of each of the items. They use problem solving strategies and a spreadsheet template to determine...
Curated OER
Application of Matrix Multiplication
The class explores a real-world application in which the data represents rental prices of beach condos. They problem solve by multiplying matrices to determine the cost of each property in each season. Several scenarios are presented in...
Curated OER
Create a Graph Online
Scholars create colorful bar, line, or pie graphs. They decide on a survey question to ask or a type of data to gather. From there, they collect information and data. They display this data in bar, line, or pie graphs that they create...


