Curated OER
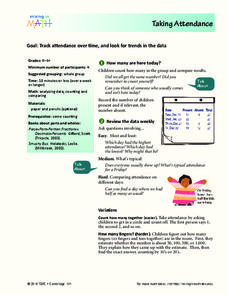
Taking Attendance
Young mathematicians record and analyze data. They will take attendance for their class and compare to other days. Then discuss ways to count who is present. They may also show the amount of learners present using fractions.
Curated OER
Data Analysis and Probability: Graphing Candy with Excel
Collect and graph data using Microsoft Excel with your math class. They will make predictions about the number of each colored candy in a bag of M&M's, then sort, classify, count, and record the actual data before using Excel to...
Curated OER
Figure This! Math Challenges for Families
Young mathematicians complete a family math challenge packet. They will complete a packet of mixed math activities. They work with graphs, comparing numerical data, tessellations, and probability.
Curated OER
Show Me The Data!
Pupils create a bar graph. They will collect and organize data to turn into bar graphs. They create graphs for the favorite sports of the class, color of M&M's, and types of cars passing by.
Curated OER
Cutting Expenses
Learners explore budgeting. In this finance and math lesson, students brainstorm ways in which households could save money. Learners view websites that give cost reducing ideas. Students complete an expense comparison chart and use the...
Curated OER
EEEK! A Spider!
Youngsters complete a unit of lessons based on the story "Little Miss Muffet." They predict what will happen in the story, and use context clues to look for meaning in the words. They research information about spiders using the Internet...
Curated OER
Penny Basketball: Making Sense of Data
Explore four web-based interactive sites to develop a baseline understanding of statistics. Learners play a series of penny basketball games and collect data regarding their shooting statistics. Groups decide who is the "top" penny...
Curated OER
Fast Talker - Ch 2 project
Tongue Twisters?! Create scatter plot graphs based on timing fellow classmates saying tongue twisters. Then investigate, display, and analyze the relationships based on functions. Wrap up this activity by making a poster or other...
Curated OER
World Oil Reserves: Assignment
Understanding and analyzing data is a critical skill. Included here are three worksheets a list of countries with the largest oil reserves, a graph of the same, and an assignment. The class uses their data to create a bar chart then...
101 Questions
Motivation to Run
Run headlong into a great resource. Young mathematicians explore the Nike+ app to see which measure of central tendency motivates runners the most. They use two screenshots of the app to help them make their determinations.
American Physiological Society
An Inquiry into Alcoholic Fermentation
Introduce life science learners to their new "best buds" yeast! Using a wide variety of materials, lab groups design an experiment that illustrates how yeast acquires the resources it needs to undergo cellular respiration. The teacher's...
PBL Pathways
College Costs 2
What is the financial benefit for attending a community college for the first two years before transferring to a four-year college? The second part of the educational lesson asks young scholars to explore this question through data...
Wake Forest University
Authentic Activities for Connecting Mathematics to the Real World
Check out the handout from a presentation that contains a collection of high school algebra projects connecting a variety of mathematics to the real world. Activities range from simple probabilities to calculus. The activities can be...
Living Rainforest
Finding the Rainforests
From Brazil to Indonesia, young scientists investigate the geography and climate of the world's tropical rain forests with this collection of worksheets.
Illustrative Mathematics
Robot Races
Analyze data on a graph to answer three questions after a robot race. Learners practice comparing ratios and reading points on a graph. Answers may vary on the last question based on accuracy of graphing. Use the lesson along with three...
Illustrative Mathematics
Rolling Dice
Rolling dice is a great way for your mathematicians to get a hands-on approach to probabilities. Use the chart to record whether they rolled a six during ten attempts. Calculate results individually (or in small groups) and then record...
Illustrative Mathematics
Bike Race
A graph not only tells us who won the bike race, but also what happened during the race. Use this resource to help learners understand graphs. The commentary suggests waiting until the end of the year to introduce this topic, but why...
abcteach
What is Your Favorite Month?
A simple worksheet that helps learners conduct a survey is here for you. In it, pupils collect data on their family and classmate's favorite months. Youngsters use tally marks in the spaces provided to keep track of the answers. Once...
Curated OER
What's in a Graph?
Students explore how to use and interpret graphs. The graphs are pulled from a variety of sources, and the activities ask students to interpret graphs. They start this lesson with knowledge of what a graph is. Students also know how to...
Curated OER
Iron Fertilization - Pumping Iron
The theory that adding iron to ocean water may increase phytoplankton ability to remove carbon dioxide from the atmosphere is examined. The Monterey Bay Aquarium Research Institute is monitoring conditions off the California coast to...
Curated OER
Raw Seafood ~ On the Half Shell
The topic is fascinating, but there is not much for learners to do here. Food borne illness has always been a problem for humans to face, and here, data from the Center for Disease Control is analyzed. Learners look at the number of...
Curated OER
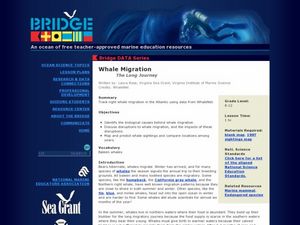
Whale Migration - The Long Journey
Marine biology learners examine right whale sighting data from the WhaleNet website. They plot the data on a map and write down the number of adults and calves spotted. Questions accompany the data analysis activity, making this a...
Curated OER
America Moves to the City (1865-1900)
Statistical data can show shifts in human populations without bias or a prescribed historical point of view. View bar graphs and charts that describe new influxes in urbanization, immigration, and suffrage by state during the turn of the...
Curated OER
Making Logic Out of Madness
Tenth graders organize and interpret data from a student health program. In this physical education lesson, 10th graders use a body composition analyzer over 8 weeks to determine the validity of a student health program. Data obtained...


