Curated OER
Solar Activity
In this solar activity worksheet, students complete a puzzle given a word bank with matching numbers. The numbers correlate to the answers to basic math problems that use the order of operations. Students use their mathematical answers...
Curated OER
Weather With a Latitude
Young scholars read the temperature from a thermometer. In this weather lesson, students read a thermometer and record the temperature at twenty minute intervals. Young scholars discuss results.
Curated OER
Weather Reporter
Fourth graders generate an oral presentation on the weather. In this weather lesson, 4th graders watch the weather for a week and record the data on a chart. Students give a weather report at the end of the week.
Curated OER
Learning to Make Line Graphs
Students analyze data and create a line graph. In this graphing lesson, students explore data from a previous experiment and plot the information on a line graph. Students analyze their findings.
Curated OER
Designing a Study
Students explore features to consider when designing a scientific study. For this science research lesson, students examine different methods of data collection and consider which method would be appropriate for determining how many...
Curated OER
Data! Data! Graph that Data!
Fifth graders create data graphs using Microsoft Excel. In this data collection instructional activity, 5th graders create and conduct a survey, then use Excel to organize and graph their data.
Curated OER
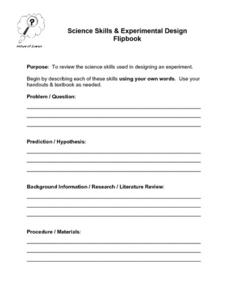
Science Skills and Experimental Design
In this experimental design worksheet, students describe the different science skills required when designing an experiment. Then students create a flipbook with the information. This worksheet has 9 short answer questions.
Curated OER
Random Sampling
In this random sampling worksheet, students compare data collected by a random sample to data collected by an actual count using pieces of paper with numbers written on them. They compare their data for the actual count to the random...
Curated OER
Conducting a Scientific Investigation
In this scientific investigation worksheet, students answer 16 questions about conducting a scientific experiment on marble's and their velocity at different ramp heights. Students write a scientific question and then go through the...
Curated OER
Projections and the Census
Learners learn why the census makes a difference. In this U.S. Census lesson plan, students connect data and history in their study of previous population booms and analyze census data in order to make predictions about the future.
Curated OER
Making a Line Graph
In this line graph worksheet, students use data given in a table and assign axes, make a scale, plot data and make a line or curve on their constructed graphs.
Curated OER
Making and Interpreting Tables
In this data tables worksheet, students make and interpret data tables given data about magazine sales. They categorize their data, complete their data table and answer questions about their data.
Curated OER
Creating Circles
Learners make a circle graph. In this graphing lesson, the teacher conducts a class survey, then demonstrates how to make a pie graph. When students are comfortable with the material, they use a worksheet to create their own graph.
Curated OER
Our Favourite Halloween Treat
Students conduct a survey about Halloween candy and create a bar graph illustrating the data. For this data analysis lesson, stud nets are introduced to the topic with a discussion and survey, then the class creates a large graph and...
Curated OER
The Perfect Principal
Students demonstrate their understanding of math skills. In this data analysis lesson, students complete a worksheet requiring them to calculate mean, median, and mode, and create and interpret graphs. Lesson is intended as an assessment...
Curated OER
How Many People Live in Your Household?
Students create a pictograph showing household size for the class.In this data collection and graphing lesson, the teacher guides students through the creation of a concrete object graph, then students analyze and summarize the results.
Curated OER
Experiment Report
In this experimental design activity, learners fill out their title, hypothesis, independent and dependent variables, data table, graph and conclusion for their lab.
Curated OER
Experimental Design Practice
In this experimental design worksheet, students are given two experimental scenarios to read. They answer questions about each including finding the hypothesis, the independent and dependent variables and controls. They design a graph...
Curated OER
2010 Census Lesson 1: It's About Us
Learners analyze data from the 2000 census to learn how the census works. In this civics lesson, students read a story to find out about the census, then use a map and census data to analyze changes. Lesson includes related resources...
Curated OER
Leveled Problem Solving: Histograms
In this using data, frequency table, and histogram to solve word problems worksheet, students solve problems about prices of toys and numbers of toys sold to solve consumer mathematics problems. Students solve six problems.
Curated OER
Valentine Hearts Investigation
Students practice analyzing data and making predictions. For this 2nd - 3rd grade lesson plan, students investigate and compare data gathered using boxes of valentine candy hearts. Students examine the different boxes of candy...
Curated OER
Holiday Tally
For this tally chart worksheet, students ask ten friends which of 3 holidays they like best. Students create a tally chart with their results and answer 6 questions.
Curated OER
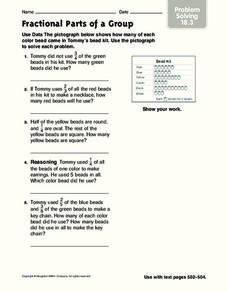
Fractional Parts of a Group
In this problem solving worksheet, students problems solve the answers to 5 mathematical word problems involving fractional parts. Students use data from a pictograph to assist them in solving each word problem.
Curated OER
Double Bar Graphs (Reteach 15.1)
In this graphs worksheet, students analyze the data on two double bar graphs. Students answer 4 questions about the information on the graphs.


