Curated OER
Power Metering Project
High schoolers collect and analyze variable data and understand the concept of electrical power. In this energy lesson students use a spreadsheet to manage their data and create box plots.
Curated OER
Are There Too Many Elk?
Students study elk populations in Arizona. In this data lesson students read an article on monitoring elk populations, analyze data and make management recommendations.
Curated OER
Olympic Line Graphs
Sixth graders examine how to make line graphs. In this Olympic line graph lesson students make line graphs and search the given Internet sites to find data on their summer Olympic Game.
Curated OER
How Creepy!
Students observe and measure a model of slow down slope movement. In this graphing lesson students collect, record, and organize data that apply to models.
Curated OER
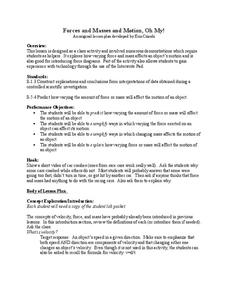
Forces and Masses and Motion, Oh My!
Students explore how varying force and mass effect the motion of an object. In this motion lesson students participate in a class activity and demonstrations.
Curated OER
Graphing With Paper and Computers
Fourth graders construct bar graphs. In this graphing lesson, 4th graders create bar graphs in connection with the story, The Copycat Fish. After creating the initial graphs on paper, students use MS Excel to create graphs.
Curated OER
Using Data Loggers
In this weather data worksheet, students use this worksheet to record data about temperature, wind speed, and more. Students complete 18 spaces on the chart.
Curated OER
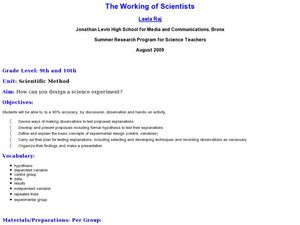
The Working of Scientists
Students define and explain the basic concepts of experimental design. In this scientific method instructional activity students complete a hands on activity, develop and present proposals to test their explanations.
Curated OER
Airport Problem
In this algebra worksheet, students are given a word problem to solve using algebraic symbols. They find a path of an airplane without the airplane retracing its path. An answer with a full explanation is included.
Curated OER
The Vietnam Lotteries
In this probability and statistics learning exercise, students examine the “fairness” to the Vietnam draft lottery system by constructing box plots of each of the twelve months using data provided. The three page learning exercise...
Curated OER
Rain Formation
First graders investigate the different water formations by conducting an experiment. In this water properties lesson, 1st graders examine jars filled with ice, rain water, air and snow in their class. Students predict what will happen...
Curated OER
Earthquake on the Playground
Learners investigate earthquakes by examining chart data. In this disasters instructional activity, students identify the waves that are recorded when an earthquake arises by reading sample graphs in class. Learners participate in an...
Curated OER
Find the Mean #6
For this find the mean #6 worksheet, 5th graders find the mean for 6 sets of numbers and write it in the box.
Curated OER
Find the Mode #3
In this find the mode #3 worksheet, 5th graders find the mode for 6 sets of numbers and write it in the box.
Curated OER
Penny Drops Experiment
In this experiment worksheet, students perform an experiment to answer the question of how many drops of water a penny can hold. This worksheet contains the hypothesis, materials, procedure, data, data analysis, and conclusion questions.
Curated OER
Looking into Surface Albedo
Pupils demonstrate how the color of materials on Earth affect the amount of solar energy that is absorbed. For this solar energy lesson students complete a lab to explore how the color of materials on the Earth's surface impacts warming.
Curated OER
Learning to Read Graphs
In this learning to read graphs worksheet, students look at the graph showing children's favorite colors, then write how many children like each of the 4 colors.
Curated OER
Graphing Worksheet: Favorite Sports
In this graphing worksheet, students analyze a bar graph in which favorite sports are displayed. Students answer 8 questions about the graph. Note: The bars in the graph are shaded in different colors.
Curated OER
Oil and Energy Consumption
Young scholars analyze the oil consumption and production information. In this investigative lesson students take the data collected, graph and organize it then draw conclusions about the use of oil worldwide.
Curated OER
Statistical Diagrams
In this statistics worksheet, students explore five activities that require analysis and interpretation of maps, charts, and scatter plots. The six page lesson includes five activities or experiments with short answer questions. ...
Curated OER
Exploring Gender Bias in the Workplace
Young scholars investigate gender bias in the work place. In this secondary mathematics lesson, students gather research on the current statistics about a profession which focuses on the female//male ratios and the pay scale of the...
Curated OER
Do You Need a Map?
Students explain ways marine navigation is important in modern society. In this map study lesson students use a retrieval tool to obtain real-time information on weather forecasts.
Curated OER
Yeast Cells and their Environment
Students study the scientific method and explore how to design an experiment. In this investigative lesson students explore and hypothesis an experiment then carry it out to find the results.
Curated OER
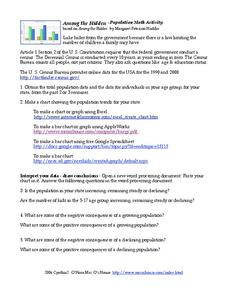
Among the Hidden - Population Math Activity
In this population worksheet, students collect data on population by researching the Census Bureau and then make online graphs and answer short answer questions about the data. Students complete 5 problems total.


