Curated OER
Let's Graph It
In this let's graph it worksheet, student interactively answer 10 multiple choice questions about graphing data and types of graphs, then click to check their answers.
Curated OER
Using Data To Make Graphs
In this using data to make graphs worksheet, students interactively answer 10 multiple choice questions then click to check their answers.
Curated OER
Gender and Income
Students investigate Income and gender preference. In this statistic lesson, students collect data of Income to see if one gender makes more than the other. Students examine the data and draw conclusions.
Curated OER
My Test Book: Tally Charts
In this online interactive math worksheet, students solve 10 problems that require them to read and interpret tally chart data. Students may submit their answers to be scored.
Curated OER
Tables, Charts and Graphs
Students examine a science journal to develop an understanding of graphs in science. In this data analysis lesson, students read an article from the Natural Inquirer and discuss the meaning of the included graph. Students create a...
Curated OER
The Correlation Between Human Population Growth and Dwindling Natural Resources
Eighth graders predict human population growth. In this lesson, 8th graders discuss the length of time needed to double the human population, work in groups to chart population growth and predict population growth in the...
Curated OER
Catches and landed value of fish
Students analyze data. In this secondary mathematics lesson, students read and retrieve data from a statistical table on the Canadian fishing industry. Students interpret and describe data in mathematical terms and make inferences and...
Curated OER
Shopping With a Circle Graph
In this shopping with a circle graph worksheet, students use the data in the graph to answer 8 questions about the money they have and how they can spend it.
Curated OER
Data Analysis
Twelfth graders collect and analyze data. In this secondary end-of-course mathematics lesson, 12th graders formulate a question they would like to answer and decide on an appropriate means of data collection. Students present their...
Curated OER
Math for Fourth Grade: Statistical Charts
In this math for fourth grade statistical charts worksheet, 4th graders answer 7 multiple choice questions in standardized test format about data, charts and graphs.
Curated OER
Ocean Exploration: How Doea you Data Grow? (Grades 7-8)
Learners explore fieldwork. In this seventh or eighth grade mathematics lesson plan, students watch a video on data collection in the field. Learners use fieldwork to gather data about their school environment. Students compile data...
Curated OER
Using Pictographs With Data
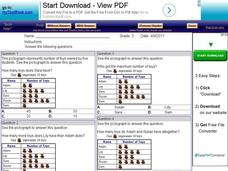
For this using pictographs with data worksheet, 3rd graders read data from a pictograph to answer ten multiple choice questions. Answers can be shown on the screen.
Curated OER
My Test Book: Reading Pie Charts
In this math skills worksheet, students solve 9 multiple choice math problems that require them to read and interpret charts. Students may view the correct answers.
Curated OER
Using Extrapolations
In this using extrapolations worksheet, 6th graders use data analysis to answer nine questions about data prediction and extrapolation.
Curated OER
Mean, Mode and Bar Graphs
In this mean, mode and bar graphs worksheet, 5th graders analyze the data given, then answer three questions about a bar graph and the data shown.
Curated OER
Active Wear
Students interpret and analyze data. In this middle school mathematics lesson, students conduct an experiment in which they investigate which solar collector, black, white, or silver, absorbs the most heat. Students examine the graphs...
Curated OER
Obstacles to Success: Misleading Data
Eleventh graders explore how data reported by country agencies can mislead the public intentionally or unintentionally. In this Cross Curricular activity, 11th graders analyze charts and graphs in order to draw conclusions. Students...
Curated OER
School Bus Minutes
For this interpreting data worksheet, students examine table regarding time spent on the school bus. Students respond to 5 short answer questions that require them to read the data and use their problem solving skills.
Curated OER
Bouncy Ball Collections
In this data table instructional activity, students examine a table regarding bouncy ball data and respond to 4 questions regarding the data.
Curated OER
Reading Graphs
For this reading graphs practice worksheet, students examine a graph and respond to 5 questions that require them to record the coordinates of 5 shapes on the gridded graph.
Curated OER
Analyze a Survey
In this analyzing data worksheet, students read a tally chart regarding survey information and respond to 4 analytical questions regarding the data.
Curated OER
Penny Drive
In this analyzing data worksheet, learners examine information regarding a penny drive and respond to 6 short answer questions pertaining to the data.
Curated OER
Population Dilemma
Ninth graders explore population growth. In this Algebra I activity, 9th graders conduct an experiment simulating population growth. Students create a model and relate the results to a real-world situation. Students create a scatter...
Curated OER
Completing frequency diagrams from displayed data
In this frequency worksheet, students use data in graphs and charts to complete a frequency diagram. Students fill in 26 spaces in the diagram.


