Curated OER
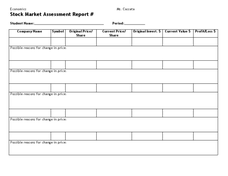
Stock Market Assessment Report
In this stock market assessment report worksheet, students track the progress of share prices in the stock market using the provided graphic organizer.
Curated OER
Designing a Speedometer
In this algebra worksheet, students analyze the designs of a speedometer. They collect data on the distance and time as the speedometer works. They draw conclusion and make predictions from the collected data. There are 4 word problems.
Curated OER
Maglev Train
In this statistics activity, students collect data on train time using speed and time. They differentiate between the upper and lower bound of their data. There are 7 questions on 2 pages.
Curated OER
Visual Communication of Quantative Data
Students collect and analyze data based on academic performance. In this statistics lesson, students create graphs and analyze the data they created. They use positive, negative and no correlation to analyze the data.
Curated OER
Hand Sensitivity
Students experiment with the sense of touch. In this tactile lesson, students determine the most sensitive area of the hand. Students experiment by describing objects through touch only. Students compare the amount of sensory data...
Curated OER
Plotting Data on a Graph
Young scholars investigate graphing. For this graphing lesson, students survey the class and create graphs to reflect the data collected.
Curated OER
Interpreting Graphs
Students investigate graphs. In this graphing lesson, students create a graph regarding the population of California. Students extrapolate answers concerning the data set.
Curated OER
Seed Germination
Young scholars explore plants and the scientific method. In this plant growth lesson plan, students follow the steps in the scientific method to perform a seed germination experiment as a whole class. Young scholars work in a group to...
Curated OER
Let's Get Physical
Students collect data using the CBL. For this statistics lesson, students predict the type of graph that will be created based on the type of activity the person does. The graph represents heart rate depending the level of activity.
Curated OER
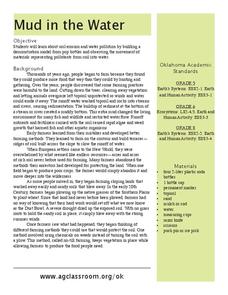
Mud in the Water
Sixth graders investigate erosion. In this erosion activity, 6th graders explore how farming changes the environment. Students construct an erosion model and research ways to protect the soil from excess mud generated by farming.
Curated OER
Results and Conclusions
Fourth graders practice using the scientific method. In this results and conclusions lesson, 4th graders review data collected, create a graph of their data and make their final conclusions about the information collected.
Curated OER
Squares in the Light
Students collect and analyze data using a graph. In this algebra lesson, students explain their findings orally and with a graph. They use their knowledge to solve real life scenarios.
Curated OER
Entrance Ticket
Students collect data on different events and word problems. In this algebra lesson, students use a table to organize their data. They graph their coordinate pairs on a coordinate plane and make predictions.
Curated OER
La Toteca- A Tropical Paradise
Young scholars collect data on the time of the ferry. In this algebra lesson, students use the data to predict a ferry schedule. They also compute the depth where oxygen would be needed when diving.
Curated OER
The Fat and the Lean
Students collect data on calorie intake. In this algebra lesson plan, students use the collection of data to make better eating decisions. They investigate the nutritional value in food using a graph and draw conclusion from their findings.
Curated OER
Mean, Median, & Mode
Students determine mean, median, and mode. In this problem solving lesson, students evaluate a set of data to determine the mean, median, and mode. Students work in small groups practicing cooperative learning skills as they problem solve.
Curated OER
From Playing with Electronics to Data Analysis
Students collect and Analyze data. In this statistics lesson, students identify the line of best fit of the graph. They classify lines as having positive, negative and no correlation.
Curated OER
Float the Boat
Students collect data and analyze it using a graph. In this algebra lesson, students identify different bodies of water and relate the flowing to math. They collect data on the rate of flow and the height of flow. They analyze the data...
Curated OER
So You Would Like a Wind Farm, Eh?
Young scholars collect and analyze data correctly. In this statistics lesson, students use central tendencies to analyze collected data. They calculate where a wind farm will be placed, based on the data.
Curated OER
Drip, Drip, Drip or The Case of the Leaky Faucet
Students explore the cost of wasted water. In this math lesson, students conduct an experiment in which they collect data on how much water is lost when a faucet leaks. Students figure the cost of the water that was wasted.
Curated OER
Collecting and Analyzing Data
In this collecting and analyzing data worksheet, students collect data from an experimental investigation about the relationship between the color of a Tootsie Roll Pop and the time it takes to get to the chocolate center. ...
Curated OER
Collecting Data
In this algebra worksheet, students collect and analyze data. They graph and identify their solutions. There is one question with an answer key.
Curated OER
Center and Spread
Students collect and analyze data. In this statistics lesson, students define and calculate the range, median and standard deviation. They identify reasons for a skewed distribution.
Curated OER
Canada Data Map
Students collect data and analyze it. In this algebra lesson, students collect data on the population characteristic in different regions. They use population, culture, settlement and others to help in their criteria.


