Curated OER
Student News And Weather Channel
Fabulous! Your 5th graders should love this project. As an ongoing lesson throughout the year students use temperature probes to record outside temperature and then document their data using spreadsheets. They use their weather data and...
University of Minnesota
Makes Me Sweat
Never let them see you sweat ... unless you can't help it! Scholars design an experiment to determine the effects of stress on the body. They monitor sweat production under different conditions and relate the response to the function of...
Curated OER
Open Inquiry Using C. elegans
Ever wondered what motivates a roundworm? Introduce your biology class to C. elegans, a non-parasitic model organism that can help them understand behavioral stimuli. Paired pupils design an experiment to test the worm's reaction to...
Anti-Defamation League
Bringing It Home
The "Bringing It Home" lesson asks scholars to investigate segregation and diversity in their school. They research, collect, and analyze local demographics. After reflecting on their personal experiences with cliques and social...
K20 LEARN
Transpiring Trees: Plant Transpiration and the Water Cycle
Looking for a tree-rific addition to your water cycle unit? Teams of young foresters examine the role of transpiration in the water cycle through a week's worth of activities. Pupils analyze how trees take in and transport water during...
Beyond Benign
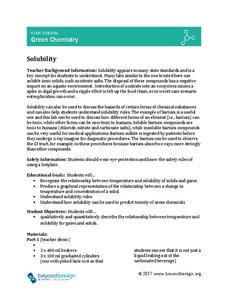
Solubility
Enhance your class' ability to understand solubility. Science scholars examine how temperature and concentration affect solubility using an interesting lab experiment. The introduction and procedure also discuss the relationship between...
Purdue University
Exploring Whirligigs
What's that silly thing spinning in the wind? It's a whirligig! Explore wonderful windy whirligigs with a STEM-based unit that teaches the science and concepts behind these gigs. Scholars discover how gravity and air resistance...
Facebook
Metadata
In previous lessons, young journalists learned about how to trace the original source of scrapes and memes. This interactive lesson plan teaches them another important step in the verification process. Participants learn how to analyze...
American Statistical Association
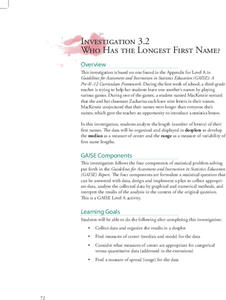
Who Has the Longest First Name?
Name that statistic! Classmates each write their name and the number of letters in it on a sticky note to place on the board. As a class, they determine the median, mode, and range of the name lengths, and create a dot plot of the data....
American Statistical Association
How Long Are the Words in the Gettysburg Address?
It's 268 words, but one only needs to consider 10 of them at a time. A data collection and analysis activity has learners investigate the lengths of words in the Gettysburg Address. They first self-select a sample of 10 words and...
Bonneville
Solar Powered Water Pumping
Here's the perfect lesson for those who think the world needs faster pumps. Building on the previous activity, scholars work to make the pumps function faster in transferring water between containers. They try adding an additional solar...
Bonneville
Making Observations and Recording Data for Solar Powered Water Pumping
Get pumped about an activity with water pumps. The fifth of seven installments in the Understanding Science and Engineering unit has pupils learn how to make observations, record data, and create data displays. Each group measures the...
PBS
Curious George: Graphing
After watching an engaging video where Curious George gets to play librarian for the day, sorting books, scholars sort information and graph their data. Learners move from concrete to picture to abstract graphing and analyze class...
Workforce Solutions
Miniature Gulf Coast Project
Scholars show what they know about data collection and analysis with an activity that examines a smaller population of Houghton, Texas. Independently or in pairs, learners identify their research question, gather, graph, and analyze...
Workforce Solutions
30 Seconds
Thirty seconds are all scholars have to develop an engaging commercial to showcase their talents and experience within a specific occupation. Pairs work collaboratively to keep each other on time to deliver information speedily and ask...
Bonneville
Titanium Dioxide Raspberry Solar Cell Data Sharing
Concerned about how well others did on the experiment? Scholars share results from the titanium dioxide raspberry solar cell test they performed in the previous lesson. After analyzing the data, they come up with a claim about the...
Bowland
Tuck Shop
Correct a misleading conclusion. Individuals review a set of data and a conclusion to determine what is wrong with the conclusion. Pupils then represent the data with an appropriate display. Finally, learners develop a correct conclusion...
School Journalism
Investigative and Data Journalism – Day Two
Class members use the Investigative Reporting Article Planner they completed the first day of the unit to guide the development of an infographic that displays what they have learned about the topic they researched.
C-SPAN
Big Data and Politics
Movie selection means more than entertainment. Learners consider what information Netflix gathers to understand the concept of "big data." Resource includes clips of experts talking about corporations that harvest the details of our...
American Museum of Natural History
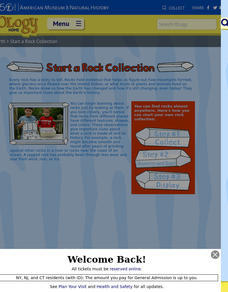
Start a Rock Collection
Rocks hold evidence of Earth's past. A three-step guide describes the process of creating a rock collection. It provides a data collection sheet to make notes about each sample.
US Department of Commerce
How Does Our Class Compare?
Compare the class to the country. As a group, pupils collect data on the types of activities boys and girls do after school. Learners compare the number of girls to the number of boys for each activity. Using census data, individuals...
US Department of Commerce
Creating and Taking a Survey
Individuals learn how to conduct surveys and collect data for the class on age, pets, and number of people at home. Scholars compare their household size to the information in the census. Pupils then develop additional questions to ask...
Equality and Human Rights Commission
Learning area 4: Learn About the Meaning of Community
Scholars examine the jobs found in their community by way of surveying. After collecting data, pupils analyze their findings and share their observations with their peers. A video sparks interest. Two posters motivate participants to...
US Department of Commerce
Make Data Speak
Data displays are more than just a bunch of numbers. Small groups access census results and create eye-catching data displays. Teams choose a statistic and collect data points for five locations. Classmates present their infographics to...


