National Council of Teachers of Mathematics
Nctm: Figure This: How Much Time Do Teens Spend on the Job?
Try this math challenge where you investigate the average number of hours teen actually spend working. Apply your problem solving, number sense, and computation skills in this one page activity from the NCTM Math Challenges for Families...
National Council of Teachers of Mathematics
Nctm: Figure This: Rose Bowl
A math challenge taken directly from the sports pages. Use your problem solving and data collection aptitude to find out how many different ways a Rose Bowl team could score 11 points. Try this one page activity from the NCTM Math...
National Council of Teachers of Mathematics
Nctm: Figure This: Majority Vote
Cast your vote for this math challenge that explores calculating percentages as it relates to voting. Discover how mastering this skill will be beneficial in real life situations. A one page activity from the NCTM Math Challenges for...
Books in the Classroom
Carol Hurst's Children's Literature Site: Data Gathering and Analyzing
Carol Hurst provides this sample chapter from "Picturing Math." Gathering data is a frequent part of solving problems and satisfying curiosity, which includes working with graphs and using mathematical tools such as averaging and other...
Rice University
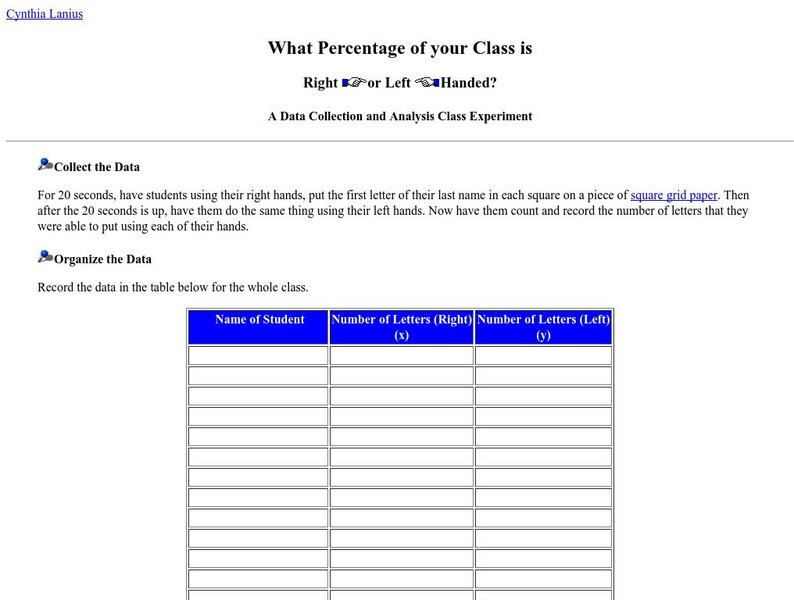
What Percentage of Your Class Is Right or Left Handed?
What percentage of the class is right or left-handed? Students will investigate this question using statistical processes of collecting the data, organizing it, graphing, and finally analyzing it. Follow-up questions are provided for the...
National Council of Teachers of Mathematics
Nctm: Figure This: Basketball Picks
A math challenge taken from the NBA that is sure to interest true basketball fans. Use your data collection, organization, and analysis skills to figure out which teams play each other. A one page NCTM Math Challenges for Families...
EL Education
El Education: "Water Quality and Future Use of Loon Pond"
An online research report entitled "2007 Report on Water Quality and Future Use of Loon Pond" by ninth grade students from Renaissance Charter School in Springfield, Massachusetts. Students completed field work testing water and applied...
Education Place
Houghton Mifflin: Eduplace: Make a Living Bar Graph
Student use simple data to line up in a living bar graph activity when they respond to simple questions in this lesson plan. They physically and visually represent the data. CCSS.Math.Content.3.MD.B.3 Draw a scaled picture graph and a...
National Center for Ecological Analysis and Synthesis, University of California Santa Barbara
Nceas: Scientific Method
This concise site from NCEAS contains an explanation of the scientific method along with a basic example of the scientific method in action.
University of Illinois
University of Illinois: Bar Graphs
Two bar graph examples are shown and explained at this website. You can learn what kind of data is best represented using a bar graph.
Jim Loy
Jl's Math Page: The Golden Rectangle and the Golden Ratio
This is a personal site from Jim Loy that describes the golden rectangle and the golden ratio. Includes several diagrams and pictures as well as formulas. A good background in math is helpful.
McGraw Hill
Glencoe: Interpreting Data Quiz
This is a quiz with five quick questions to check your understanding of how to interpret data. It is self checking.
McGraw Hill
Glencoe: Collecting and Analyzing Data Quiz
This site is a quiz with five quick questions to check your understanding of how to collect and analyze data. It is self checking.


