Curated OER
Binary Operations
In this binary operations learning exercise, 9th graders solve 12 different problems related to various binary operations. First, they determine whether the operation is commutative. Then, students name the identity element and explain...
Curated OER
Reading and Making Pie Graphs
In this pie graphs worksheet, students solve 10 different problems that include reading a pie graph. First, they use the pie graph to respond to 5 questions that follow. Students determine the year that had the smallest and largest...
Curated OER
Word Problems
For this word problem worksheet, 6th graders solve 5 different word problems related to the data table shown. First, they determine the average of the overall scores as shown in the table and the mean of the overall scores. Then,...
Curated OER
Graphing Information from a Data Table
In this graphing worksheet, students solve 12 problems in which data on a table is presented on a bar graph. This page is intended to be an online activity, but may be completed with paper and pencil.
Curated OER
Angles and Arcs
In this angles and arcs worksheet, 10th graders solve 18 various types of problems related to determine various angles and arcs of a circle. First, they find the measure of each angle and arc of the first circle shown. Then, students...
Curated OER
Questionnaires and Analysis
Students, review the techniques and different types of data analysis as well as how they are expressed, identify why facts and data are needed in conclusion of a questionnaire. The concepts of qualitative and quantitative data are...
Curated OER
The Blizzard of 1993
Students read and interpret the information from a barograph from a major winter storm. This task assesses students' abilities to interpret and analyze graphs, construct data tables and graphs, generalize, infer, apply knowledge of...
Curated OER
Positive Future Fair Project
Ninth graders view the film "Pay It Forward" and discuss what kind of public campaign is needed to move people to positive action. They consider different ways of presenting information (graphs, visual displays, etc.) as tools for...
Curated OER
Meatiest States: Graph Problem Solving
In this graph problem solving instructional activity, students analyze a graph that shows commercial red meat production in five states. Students answer 5 word problems using the data on the graph.
Curated OER
Use a Graph Reteach 4.8
For this graph worksheet, students solve 3 problems using a data table and bar graph. Students write number sentences to figure out answers to the questions about kinds of toys in a shop.
Curated OER
Graph: Number of Laysan Albatross Nests and Chicks at Kilauea Point
In this bar graph worksheet, students solve and complete 2 problems related to reading a bar graph. First, they use the data table found at the bottom of the sheet to complete the bar graph which illustrates the number of nests and...
Curated OER
Counting Squares
For this counting squares worksheet, students solve 2 problems that include counting 2 different sets of squares. First, they draw a picture of four squares arranged in two rows of two. Then, students determine the total number of...
Curated OER
Numeracy Practice- Going Out For Lunch
In this math learning exercise, learners complete the various types of activities that include graphs, data tables, and completing number sentences.
Curated OER
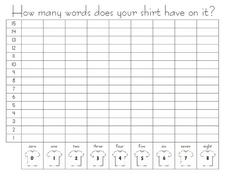
How Many Word Does Your Shirt Have on It? --class Bar Graph
In this math worksheet, students participate in a group bar graph activity. Students survey classmates about how many words, if any, are on their shirts. Results are plotted on a bar graph.
Curated OER
Closing the Case
Fifth graders collect data and prepare data displays using a survey with statistical information.
Scholastic
Scholastic: Cultivating Data
Students will understand key concepts of data analysis and their graphic representations. Students will construct and interpret data tables, line plots, box-and-whisker plots and stem-and-leaf plots, scatterplots with line of best fit,...
National Council of Teachers of Mathematics
The Math Forum: Seventh Grade Mathematics: Data Sense
This site has some interesting ways to collect and evaluate data. There are some activities about note taking, spreadsheets, surveys, and a cool bridge construction project. Teachers may want to use this site as a resource for some...
Texas Instruments
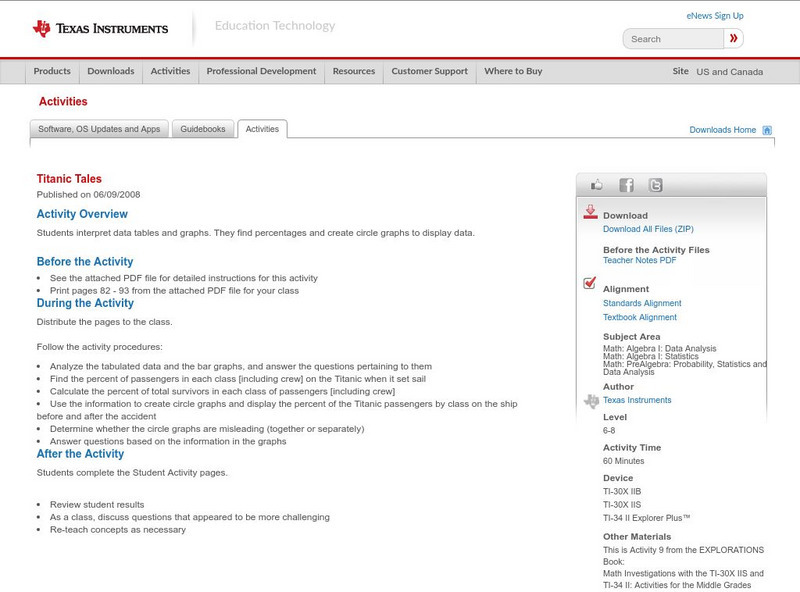
Texas Instruments: Titanic Tales
In this activity, students interpret data tables and graphs. They find percentages, and create circle graphs to display data.
Science Education Resource Center at Carleton College
Serc: Introductory Concepts in Soil Chemistry
In this introductory lab activity, students will collect data that will graphically illustrate the relationship between mass and volume in determining the density in chemistry. Based on density, students will seek to determine a...
Texas Instruments
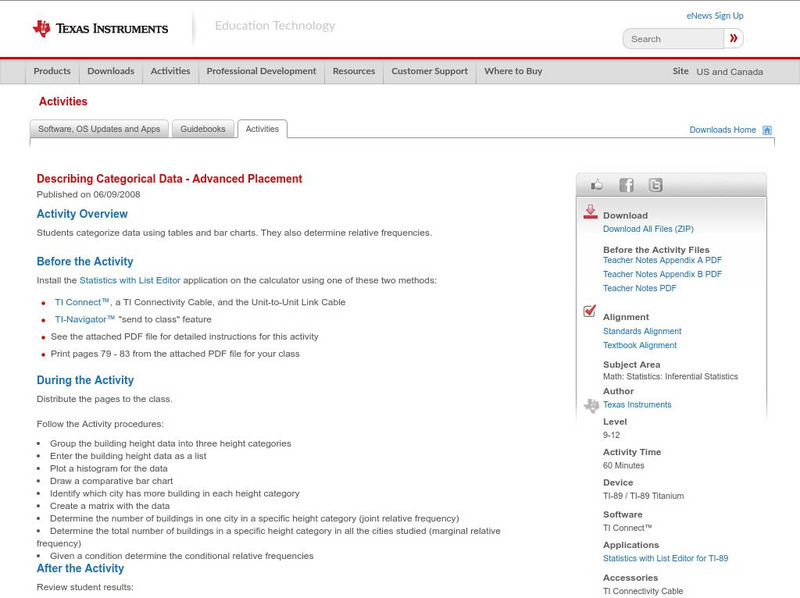
Texas Instruments: Describing Categorical Data Advanced Placement
Students categorize data using tables and bar charts. They also determine relative frequencies.
University of Georgia
University of Georgia: Inter Math: Types of Data
This site has a concise definition of "Data," plus examples of data types and collection methods.
National Council of Teachers of Mathematics
Nctm: Figure This: Play Ball
Make a table to figure out if a baseball valued at $3000 in 1927 is worth more than a baseball valued at $3 million in 1999. Which is a better investment?
ClassFlow
Class Flow: Types of Graphs
[Free Registration/Login Required] This flipchart explores the use of graphs. Bar graphs, tables and circle graphs are discussed.
Rice University
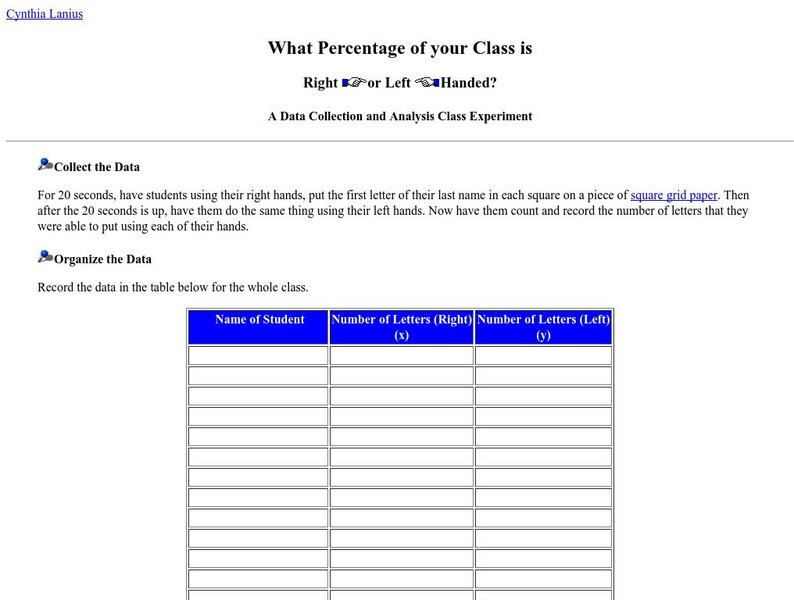
What Percentage of Your Class Is Right or Left Handed?
What percentage of the class is right or left-handed? Students will investigate this question using statistical processes of collecting the data, organizing it, graphing, and finally analyzing it. Follow-up questions are provided for the...


