West Contra Costa Unified School District
Key Features of Graphs
The key is ... After a day of instruction on key features of graphs, groups create a poster and presentation on the key features of their given function graph. The resource provides an extension activity of "telephone" using...
EngageNY
Representing, Naming, and Evaluating Functions (Part 2)
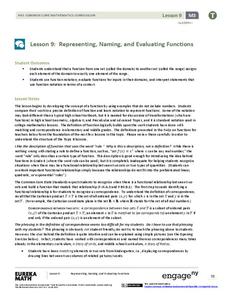
Notation in mathematics can be intimidating. Use this lesson to expose pupils to the various ways of representing a function and the accompanying notation. The material also addresses the importance of including a domain if necessary....
EngageNY
Representing, Naming, and Evaluating Functions (Part 1)
Begin the discussion of domain and range using something familiar. Before introducing numbers, the lesson uses words to explore the idea of input and outputs and addresses the concept of a function along with domain and range.
EngageNY
Equations Involving a Variable Expression in the Denominator
0/0 doesn't equal 0! Begin this lesson plan by allowing the class to explore the concept of dividing by zero. The introduction allows for discovery and provides meaningful examples of dividing by zero. This understanding leads to solving...
EngageNY
Graphs of Piecewise Linear Functions
Everybody loves video day! Grab your class's attention with this well-designed and engaging resource about graphing. The video introduces a scenario that will be graphed with a piecewise function, then makes a connection to domain...
Houston Area Calculus Teachers
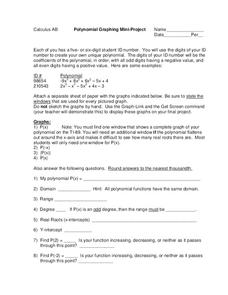
Polynomial Graphing
Your AP Calculus learners probably have their ID numbers memorized, but have they tried graphing them? Pique your pupils' interest by asking each to create a unique polynomial function based on their ID numbers, and then analyze the...
West Contra Costa Unified School District
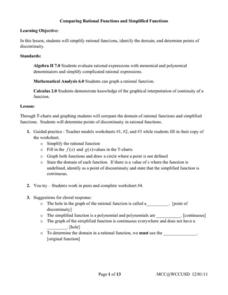
Comparing Rational Functions and Simplified Functions
What kind of functions have holes in their graphs? Here, the teacher guides the class on how to use the simplified function of a rational function to aid in the graphing of the original rational function. T-tables are used in order...
Mathematics Vision Project
Module 5: Features of Functions
The language and features of functions get careful treatment in a complex but doable lesson. Learners get a lot of practice really figuring out what a graph means in context, and also identifying key features of graphs. Key ideas...
Mathematics Vision Project
More Functions, More Features
Learners tackle a wide range of intimidating topics in this comprehensive unit that spans piecewise functions, absolute value of functions, and inverse functions (among other topics). Investigative group work alternates with more...
Mathematics Vision Project
Quadratic Functions
Inquiry-based learning and investigations form the basis of a deep understanding of quadratic functions in a very thorough unit plan. Learners develop recursive and closed methods for representing real-life situations,...
Math Wire
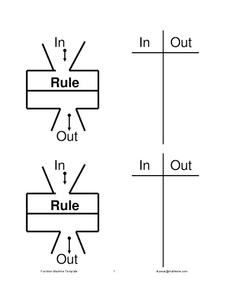
Function Machine
Provide your mathematicians with a way to organize their algebraic functions with this function machine handout. Each sheet provides a place to write down the rule and then either a t-table or full table to organize their input and output.
Illustrative Mathematics
Function Rules
Function machines are a great way to introduce the topic of functions to your class. Here, you will explore the input and output to functions both using numerical and non-numerical data. Learners are encouraged to play with different...
Curated OER
Exercise Set 2.7: Functions and Graphs
In this functions worksheet, students solve 40 short answer problems. Students determine if a graph represents a function. Students find the domain of absolute value and square root functions.
Curated OER
Calculating Intervals Using Stokes' Theorem
For this calculating intervals worksheet, students calculate intervals using Stokes' Theorem. They justify their answers with words and pictures. This two-page worksheet contains 3 multi-step problems.
Curated OER
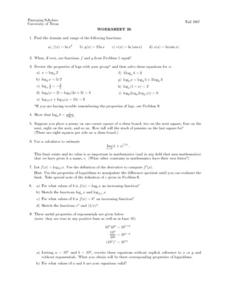
Worksheet 26 - Functions & Logarithms
In this function and logarithms worksheet, students find the domain and range of functions, use the properties of logs to solve equations. This one-page worksheet contains nine multi-step problems.
Curated OER
Quiz: Logarithmic Functions
Explore logarithmic functions, and have pupils solve 10 different problems that include various logarithmic functions. First, they find the domain of a given function and then the range. They also consider a graph that has a limited...
CPM
Tables, Equations, and Graphs
Eighth and ninth graders solve and graph 24 different problems that include completing input/output tables and graphing the pairs. First, they find the missing values for each table and write the rule for x. Then, learners write the...
Texas Instruments
Graphs of Rational Functions
Take your kids on a tour of graphing rational functions. Using this TI lesson, high schoolers identify the end behavior of their functions. They find the domain and range, describe end behavior, and look at asymptotes and restrictions of...
Curated OER
Profitable Soda Stand
Am I making any money? Help learners determine if their fictitious soda stand is turning a profit. They graph linear equations using the slope and y-intercept and identify the best price to use to sell soda. They identify the domain and...
Curated OER
Algebra I: Linear Functions
Using rates from a rental car company, young mathematicians graph data, explore linear relationships, and discuss the role of slope and the y-intercept. This lesson plan allows for the discussion of independent and dependent variables,...
Curated OER
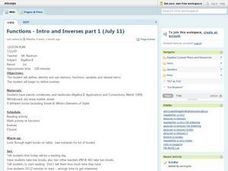
Functions - Intro and Inverses
Define the terms domain, range, function, vertical limit test, and linear function notation with your class. They can then, graph several equations applying the vertical line test to determine which are and which are not functions, write...
Curated OER
Mathematical Modeling
Study various types of mathematical models in this math lesson. Learners calculate the slope to determine the risk in a situation described. They respond to a number of questions and analyze their statistical data. Then, they determine...
Curated OER
Classification/Taxonomy/Statistics Review
"Does King Phillip Cry Over Flimsy Grass Stems?" You might not answer that question with this exhaustive worksheet, but your biology class will get the full scoop on the hierarchy of biological classification with this resource. It...
Curated OER
Operations with Functions
This is a very strange but fairly amazing worksheet. You plug-in the number of problems, how you'd like them arranged, and if answers should be available and click retrieve. Like magic a worksheet to your specifications pops up. This...


