Curated OER
Measuring Dispersion
Students compute the standard deviation for a given set of data. In this measuring dispersion instructional activity, students compute the mean, and then the distance from the mean for each data point. They find the standard deviation of...
Curated OER
Unit 18 Quantitative Data
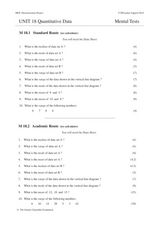
In this central tendency activity, students answer 30 short answer questions about data sets. Students find the median, mean, mode, and range of data sets.
Curated OER
Exploring Data Sets and Statistics in Baseball
Students explore the concept data sets. In this data sets lesson, students find the 5 number summaries for salaries of teachers and compare them with 5 number summaries of professional baseball players. Students use box and...
Curated OER
Statistics
In this statistics worksheet, 9th graders solve and complete 10 various types of multiple choice problems. First, they determine the mean number of miles per day that were completed. Then, students determine the data set that has a...
Curated OER
Analyzing Data Sets
In this analyzing data sets worksheet, 11th graders solve and complete 35 various types of problems that include the analysis of data given. First, they determine the equation that best describes the data shown in a table. Then, students...
Curated OER
Central Tendency
In this central tendency instructional activity, 8th graders solve 10 different problems that include determining the mean, mode, and median of various situations. First, they prepare a frequency distribution with a class interval for...
Curated OER
Graphs to Represent a Data Set
Here are the number of animals Jackson saw at the zoo; scholars organize data into bar graphs using this worksheet. Encourage labeling, but consider having scholars do these on another sheet because there isn't room for the x-axis to be...
Curated OER
Jumping to Conclusions
Students decide as a class what their data is going to be to graph. In this math lesson plan, students organize data so that it will be easier to display in a graph. Students are guided through the process by their teachers, and helped...
Curated OER
Reading Frequency Tables
In this data interpretation worksheet, students record the data from 10 examples into frequency tables. They group 10 more data sets, and make a frequency table for each.
Curated OER
Scatterplots
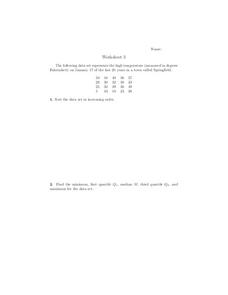
In this scatterplots worksheet, 9th graders solve and complete 6 different word problems with different sets of data. First, they sort the data set in increasing order and find the minimum, first quartile, median, third quartile, and...
Curated OER
Independent Practice 1: Box and Whisker Plot
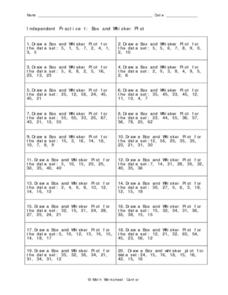
For this box and whisker plot worksheet, students create a box and whisker plot from a given set of data. They identify the lower quartile, upper quartile, the mean, and outliers. This one-page worksheet contains 20 sets of numbers...
Curated OER
Pi Digit Distribution
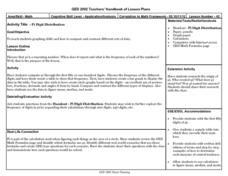
Students study graphing skills and compare and contrast data sets. They compute pi through the first 50-100 digits and create a bar graph showing the frequencies of specific digits.
NASA
Nasa Space Science Data Archive: The Mariner Missions
This web page contains detailed information on the Mariner 4 spacecraft. The page explains that the Mariner 4 was the first spacecraft to obtain information at close range on Mars. This page also contains information about other Mariner...
Concord Consortium
Common Online Data Analysis Platform (Codap)
CODAP is a free, easy-to-use data analysis environment for students. Students can load their own data into an easy-to-use web-based data analysis tool to create their own datasets, share visualizations, and discover data-driven insights....
Math Drills
Math Drills: Statistics and Probability Worksheets
Download these free worksheets to sharpen your skills with statistics and probability. Sheets focus on collecting and organizing data, measures of central tendency (mean, median, mode, and range), and probability.
Cuemath
Cuemath: Mode
A comprehensive guide for learning all about mode with definitions, how to find it, solved examples, and practice questions.
Cuemath
Cuemath: Mean, Median and Mode
A comprehensive guide for learning all about mean, median, and mode with definitions, the relation between them, solved examples, and practice questions.
Scholastic
Scholastic: Shake, Rattle & Roll
Students will learn and reinforce skills for creating and analyzing scatterplots and histograms; using cost-benefit analysis to make predictions from data and using tree diagrams to understand outcomes of events.
Cuemath
Cuemath: Discrete Data
A comprehensive guide for learning all about discrete data with definitions, the difference between discrete and continuous data, graphical representation of discrete data through visualization, solved examples, and interactive questions...
Cuemath
Cuemath: Measures of Central Tendency
A comprehensive guide for learning all about measures of central tendency with definitions of mean, median, and mode, solved examples, and practice questions.
BSCS Science Learning
Bscs: Chesapeake Bay Algal Blooms
In this inquiry, students engage with mapping data to determine what kind of land coverage is contributing the most to harmful algal blooms in the Chesapeake Bay Watershed. Click on the link for teacher resources for teaching guides and...
Mangahigh
Mangahigh: Data: Understand Discrete and Continuous Data
This site provides students practice with the concept of discrete and continuous data. Students can learn about the topic by completing an interactive tutorial. Students can then take a ten question timed test to practice the skill.
Khan Academy
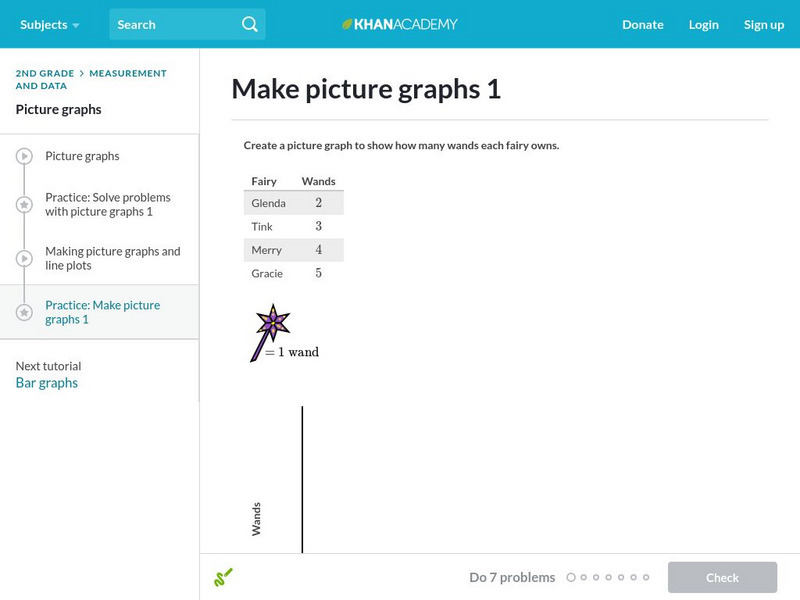
Khan Academy: Make Picture Graphs 1
Practice creating picture graphs (pictographs) from data sets. Students receive immediate feedback and have the opportunity to try questions repeatedly, watch a video or receive hints.
Illustrative Mathematics
Illustrative Mathematics: Understanding the Standard Deviation
The purpose of this task is to deepen student understanding of the standard deviation as a measure of variability in data distribution. The task is divided into four parts, each of which asks students to think about standard deviation in...


