Curated OER
Angles of Elevation and Depression
In this angles of elevation and depression worksheet, 10th graders solve 4 word problems that are related to determining the angles of elevation and depression. First, they define angle of elevation and angle of depression as used in the...
Curated OER
Angles of Elevation and Depression
For this angles of elevation and depression worksheet, 10th graders solve 6 word problems that include finding angles of elevation and depression. They solve each problem, rounding the measures of segments to the nearest hundredth and...
Curated OER
Velocity and Acceleration
In this velocity and acceleration instructional activity, students determine the distance walked and the displacement of a person who walks 15 m west and 20 m east. Then they determine the resultant velocity of a bicyclist who rides 10...
Curated OER
Elevation at its Peak
Young scholars pretend they are hiking up a mountain. They practice making calculations on angles and elevation. They use topographic maps to estimate distances and trigonometric ratio methods.
Curated OER
Sun, Shadows, Surface Structure...and the Face on Mars
Young scholars use light and shadow information to make inferences regarding the three dimensional shapes of specific objects photographed on the surface of Mars. Limitations of the of the data provided are discussed and entries made...
Curated OER
Extreme Elevation: Student Worksheet #2
In this elevation worksheet, young scholars determine the highest point and lowest point of given areas. They find the difference in the elevation.
Curated OER
Hottest, Coldest, Highest, Deepest: Science, 4th Grade
Fourth graders investigate weather patterns in their home state of Utah. After creating KWL charts, they research weather and geographical data to locate the state's extremes. As an extension, 4th graders write and illustrate books about...
Curated OER
Mapping It Out
Fourth graders examine various aspects of the environment of Utah. In groups, they create four maps of Utah, based on temperature, precipitation and elevation. To end the instructional activity, they are asked a question as a group and...
Curated OER
How Low Can You Go?
Pupils are introduced to the concepts of elevation and slopes. Using Minneapolis and St. Paul, they graph elevation of various cities in a scenerio given to them. They also calculate the total miles traveled and organize the...
Curated OER
Oregon Rainshadows
Young scholars brainstorm list of possible highest locations in Oregon, identify and label places from list on map using color code, and discuss and identify causes of a rain shadow.
Curated OER
Outdoor Education; Maps, Elevation
Ninth graders use online topographical maps to fill in a chart regarding elevation and contour lines.
Curated OER
Mission Planning: Earth/Mars Comparisons
Students compare and contrast conditions on Mars to those on our own planet, specifically, their local or regional environments. The physical characteristics, the atmosphere, and other astronomical data is considered.
Curated OER
Stargazers and Skywatchers
Students are introduced to the apparent motion of the Sun across the sky and the way it changes in summer and winter.
Georgia Department of Education
Ga Virtual Learning: Weather and Climate
In this amazingly comprehensive interactive tutorial you will learn how factors such as ocean currents, topography, and air currents affect weather patterns. You will also learn the similarities and differences between weather and climate.
Other
Ordnance Survey: Map Zone: Relief and Contour Lines
Discover how to read and show height on maps using relief and contour lines.
Utah Education Network
Uen: Mapping It Out
Learn about Utah's environments, temperature, elevation, and rainfall.
PBS
Pbs Learning Media: Cyberchase: Competing for the Northern Hemisphere Games
In this short Cyberchase video, students learn about positive and negative numbers as Harry tries to score a total of 50 points in various events to qualify for the Northern Hemisphere games in New Orleans. [3:24]
Science Education Resource Center at Carleton College
Serc: Investigating Contour Maps: Creating Contour Maps by Surveying
In this activity, the students will understand how contour maps are created and appear the way that they do by using various materials to create and compare contour lines of different elevation levels.
Science Education Resource Center at Carleton College
Serc: Topographical Maps, Contour Lines and Profiles
In this mapping field lab middle schoolers determine the elevation of a given object in a designated area on the school campus using cartography tools. Then they use of these tools to create a contour map of the area.
Science Education Resource Center at Carleton College
Serc: Investigating Neighborhood Wetlands
In this Environmental Science and Engineering field activity, students will map a neighborhood wetland and generate various watershed questions. Students will identify engineered structures in or around this wetland and consider how...
Science Education Resource Center at Carleton College
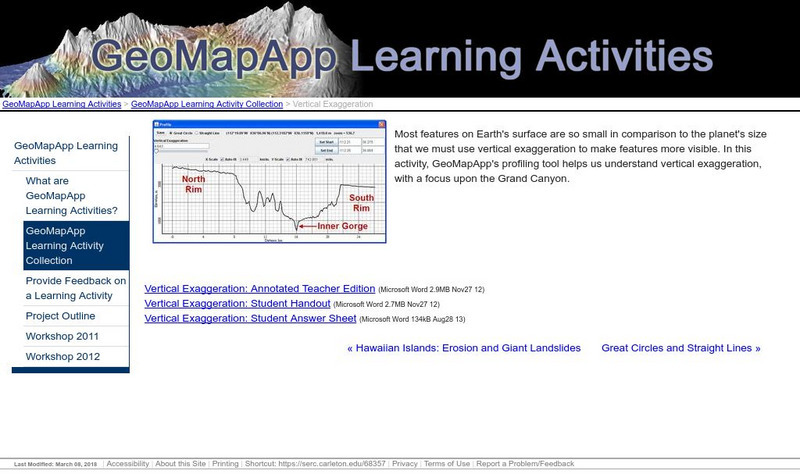
Serc: Vertical Exaggeration
In this lesson, students will utilize GeoMapApp's profiling tool to understand vertical exaggeration, with a focus upon the Grand Canyon.
OpenStax
Open Stax: Types of Body Movement
This site provides information regarding types of body movement. Movement types are generally paired, with one being the opposite of the other. Body movements are always described in relation to the anatomical position of the body:...
Curated OER
Kids Health: Strains and Sprains Are a Pain
In addition to describing how one might get a strain or sprain, this article offers well-organized, clear advice for those caring for their sprained or strained muscles. Links to related information included.
TeachEngineering
Teach Engineering: Getting to the Point
For this lesson, students learn how to determine location by triangulation. We describe the process of triangulation and practice finding your location on a worksheet, in the classroom, and outdoors.


