Curated OER
Where Do You Shop?
Learners examine shopping patterns in another community to develop a hypothesis on why there are more opportunities for goods and services in some neighborhoods while others lack these goods and services.
Curated OER
A Country’s Shape Is More Than Its Borders
In this geography skills instructional activity, students read an article and examine graphs about population prior to answering 13 short answer questions and 10 multiple choice questions. Students then respond to the writing prompt...
Curated OER
The First Nations, Métis, and Inuit Peoples of Canada
Learners explore demographic shifts. In this Canadian Census lesson, students interpret data from the 2006 Census to determine the needs of the Aboriginal population in the country.
Curated OER
Urban and Rural Communities
Students discuss similarities and differences of urban and rural communities. For this urban and rural communities lesson, students compare urban and rural communities using a Venn Diagram. Students examine maps of each type of...
Curated OER
Exploring the USA and the World with Cartograms
Middle schoolers investigate cartograms in order to explore the different countries on Earth. In this world geography activity, students use the Internet to analyze data on different cartograms. Middle schoolers compare data, such as...
Curated OER
New Toy Project
Pupils create a new toy for a toy company. They determine the demographics of the target market and explain their decision. Students use the six steps of new product development to develop a new toy for the selected target market.
Curated OER
PETA Pressure
High schoolers examine what a "target audience" is and evaluate the PETA website for tactics that exploit the characteristics of their target audience. They read and discuss a handout, analyze the PETA website in small groups, and...
Curated OER
Population Growth and Urban Planning
Students discuss the following terms and their definitions: zero population growth, population density, demographics, urban sprawl, census, immigration, migration, infrastructure, population booms, megacities, birthrate, death rate,...
Curated OER
Utah at the Crossroads: Challenges for K-12 Education in the Coming Ten Years
Students discuss the difficulties in financing public education in Utah. They examine how Utah students perform on standardized tests. They focus on the coming enrollment boom in K-12 education and slowing economy and what effects these...
Curated OER
If the World Was a Village...Examining Ethnocentrism
Seventh graders examine their own perceptions of world's people, compare those perceptions to real demographic data, provide definition and understanding of term "ethnocentrism," and examine their own ethnocentrism based on comparison of...
Curated OER
The Demographic Transition - A Contemporary Look at a Classic Model
Young scholars examine classic demographic transition (DT) model, explain assumptions and limitations of model, construct graphs of contemporary demographic change, and explain contemporary demographic patterns in the context of the...
Curated OER
Human Population Ecology: Demography
Students describe the basic concepts of population demography. They collect a wide range of data from an online cemetery database including a variety of places across the U.S. They analyze factors that may have affected human demography...
Curated OER
Sports Franchises: The Demographic Dimension
Students examine how U.S. population patterns have changed over time. Using the growth of major league baseball to illustrate these patterns, students create maps, examine regional migration patterns, and make predictions for the future.
Curated OER
Using Current Data for Graphing Skills
Students graph demographic information. In this graphing instructional activity, students choose what type of graph to create and what information to display. Links to examples of graphs and statistical data are provided. The graphs are...
Curated OER
Demography and Services of Fairfax County, Virginia
Twelfth graders are introduced to the demographics and services of Fairfax County, Virginia. In groups, they identify programs and services that should be supported by tax dollars and presnt them to the class in a PowerPoint presentation.
Curated OER
Demography of Roosevelt Over Time
Students examine how the demographics of their high school have changed over time. After collecting and graphing data, they write their conclusions. They share their analysis with the class and compare them with others.
Curated OER
The Baby Boom -- How Do We Know it is a Boom?
Students examine graphs of three statistics and use basic math to compute their own. They evaluate the implications of manipulating data and whether statistics are appropriate for creating policy.
Curated OER
Count On Us: Concepts and Applications of Demography
Eighth graders use the Internet to research demographics of certain areas. They use the U.S. Census Bureau's website to help them gather information. They use their data to find a solution to a hypothetical problem.
Curated OER
Maine: State Facts
Students participate in various activities focusing on facts about Maine. They participate in interactive lessons with trivia facts, symbols, and statistics. They research the meaning of the state flag.
Curated OER
Neighborhood statistics
Students examine statistics relating to neighborhoods. They use the data to explain how a population affects their environment. They discuss how businesses use statistics to find out information about their clientele.
University of Missouri
Cia World Factbook: Reunion
Contains detailed information about Reunionese people, the geography and economy, government, military, and communications of this French island department. (2005)
Association of Religion Data Archives
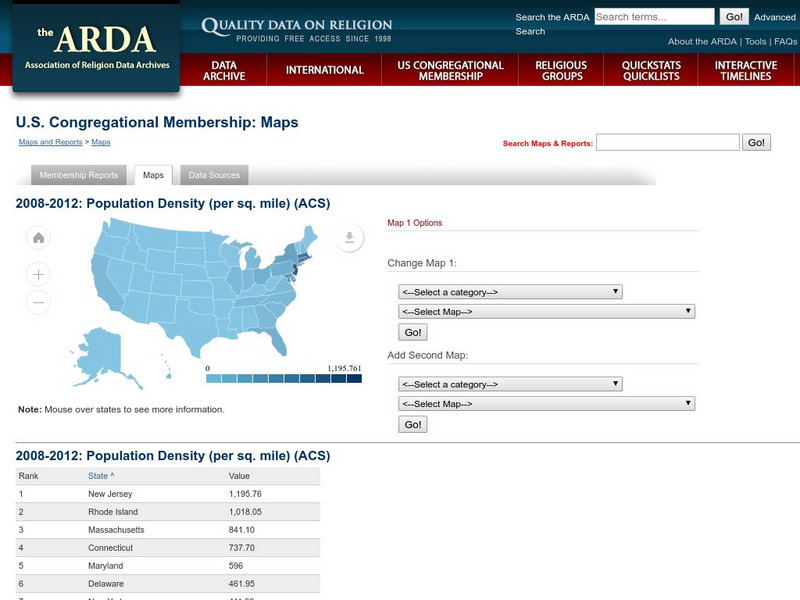
Association of Religion Data Archives: u.s. Population Density Map
Interactive tool that lets you choose a map (Census or Religion), then choose demographic or religious profiles to create a slideshow.
Other
Mapping Worlds: Show World: A New Way to Look at the World
This unique combination of data, demographics and innovative visuals resizes countries on a world map in relation to a menu of insightful data-driven topics, such number of deaths from cancer or amount of steel produced, giving us a new...
Other
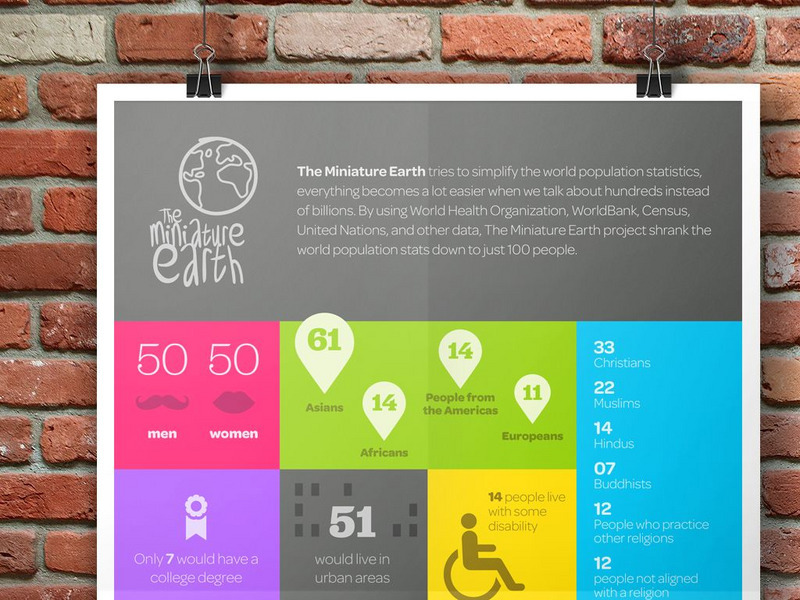
Miniature Earth: Comparative Demographics Worldwide
Miniature Earth reduces the world's population to 100 to underscore the dramatic differences in wealth, age, faith, education, environment, and health among people who live on this planet. An excellent apply-what-you-know site for...


