College Board
2016 AP® Physics 2: Algebra-Based Free-Response Questions
While AP Physics 1 counts as an introductory college Physics course, AP Physics 2 counts as a second-year college Physics course. Help scholars prepare for this more advanced college-level test with questions from previous assessments...
Fluence Learning
Writing About Literature: Comparing and Contrasting Characters in Heidi
Scholars read excerpts from the story, Heidi, in a three-part assessment that focuses on comparing and contrasting characters. Each part contains three tasks that challenge learners to discuss, answer comprehension...
EngageNY
The Relationship of Multiplication and Division
Take any number, multiply it by five, and then divide by five. Did you end up with the original number? In the same vein as the previous lesson, pupils discover the relationship between multiplication and division. They develop the...
EngageNY
The Relationship of Addition and Subtraction
Add an outstanding resource to your repertoire. The first installment of a 36-part module looks at the relationship between addition and subtraction through an activity using tape diagrams. Pupils develop the identities w – x + x =...
Doing Maths
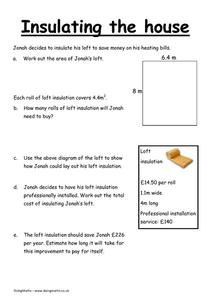
Insulating the House
Finding the area of a rectangle is the focus of this metric worksheet. Here, mathematicians use their knowledge of finding the area of a shape in meters to discover how much material can fit inside a shape.
Scholastic
Back from the Dead
If you could bring back one extinct animal, what would it be? That is the question your class will ponder. Your budding scientists read a passage, follow a cloning timeline, and review a diagram about the process of reviving a woolly...
Lrymple Secondary College
Plate Boundary
Scholars examine diagrams and complete a concept map to discover key details about convergent, divergent, and transform plate boundaries.
National Geographic
Steps in a Process Diagram
Start at step one with this straightforward graphic organizer! Learners write down five steps in a process to complete the worksheet. Arrows point from one box to the next to show the relationship between steps.
Curated OER
Lesson 3: Labeled Diagrams
Examine the book Stargazers by Gail Gibbons. Young readers will practice reading and interpreting information from diagrams in this informational text. They work together as a class on this skill and then move into independent...
US Apple Association
Apples: A Class Act! (Grades Pre-K–3)
Discover the nutritional wonders of apples and get to know Johnny Appleseed with a plethora of learning experiences that cover subjects math, history, English language arts, health, and arts and crafts. Activities include an apple...
Curated OER
Put Your Habits to Work in Math
Learning how to read an expository text is an essential skill. The questions on this two-page worksheet lead pupils to understand that the title, heading, diagrams, photographs, problems and captions all support the main idea of a...
Curated OER
Re-Presenting Race in the Digital Age
Teen-aged scientists analyze a graphic organizer of how trash is removed from New York City and then answer standard questions about a graph and a diagram. Resources are mentioned, but there are no links to these resources, so you will...
Curated OER
Get to The Root of It!
Students study a real plant to explore its parts. They discover the function of the plant parts which they diagram and label.
Curated OER
Teaching Neuro-anatomy Through Schematic Diagrams
Students develop a deeper understanding of the brain. In this neuro-anatomyl lesson plan, students will use simple diagrams to understand the brain and will progress to more complex diagrams as they gain understanding.
Curated OER
Basic Exercises in Logic
In this logic worksheet, students are taught about the use of syllogisms to solve problems. They use diagrams to visually show the relationships between objects. They complete two given syllogisms and answer questions about their results.
Curated OER
Problem Solving with Diagrams, Part One
In this diagrams worksheet, students use diagrams to help them solve fraction word problems. Students complete 4 problems on this worksheet.
Curated OER
Water Works
Learners complete discussions and activities about the cost, use, and filtration of Canada's water supply. In this water lesson plan, students compare the use of water in Canada with other countries.
Curated OER
Birth and Death Rates in European countries
Students discover the world as a global community and the social implications. They construct graphs to represent data, interpret diagrams and draw inferences.Students create a report, which could lead to a class discussion.
Curated OER
Cost of living
Students explore the cost of living differences within Europe by interrogating data within tables and graphs. They investigate personal incomes, earnings of selected occupations, monthly earnings and incomes by education.
Curated OER
Optical Images
Ninth graders study optics and the law of reflection. In this optical images lesson students use a laser and conceptualize the law of reflection.
Curated OER
Comprehension Word Problems
Fourth graders solve word problems. In this ordinal numbers problem solving lesson, 4th graders draw a diagram to support their answers on a worksheet.
Curated OER
Branches of Government Graphic
Students explore the three branches of government. They create a graphic diagram to show each branch of government. Students include the qualifications for service and duties of each branch of government in their graphic diagram.
Curated OER
CREATE A FISH
Students watch a video that helps shows them how a diagram, flow chart, or blueprint can help them create a 3-d fish with the correct anatomy to live in a realistic environment.
Other
Bucks County Community College: Visual Organizers
This site walks you through the benefits of visual organizers, and focuses on a variety of types: tables, charts, graphs, timelines, flowcharts, diagrams, and webs.


