Mathematics Assessment Project
College and Career Readiness Mathematics Test A2
A six-page evaluation covers material included in algebra, geometry, and algebra II. Applied word problems are mixed in with short answer questions. It also provides questions on mathematical reasoning.
Charleston School District
Review Unit 4: Linear Functions
It's time to show what they know! An assessment review concludes a five-part series about linear functions. It covers all concepts featured throughout the unit, including linear equations, graphs, tables, and problem solving.
EngageNY
Graphs Can Solve Equations Too
There are many equations Algebra I students are not ready to solve. Graphing to solve gives them a strategy to use when they are unsure of an algebraic approach to solve the problem. The lesson exposes learners to a wide variety of...
Curated OER
Narrow Corridor
Buying a new sofa? Learn how to use the Pythagorean Theorem, as well as algebra and graphing techniques, to determine whether the sofa will fit around a corner (which I'm sure you'll agree is a very important consideration!).
West Contra Costa Unified School District
Connecting Graphing and Solving Absolute Value Equations and Functions
Can you solve an equation graphically? Absolutely! This Algebra II lesson makes the connection between solving an absolute value equation and graphing two functions. Graphing absolute value functions is presented through the process of...
West Contra Costa Unified School District
Graphing Systems
Get hands on with solving systems of equations graphically. A solid lesson plan uses guided practice to show how to solve systems of linear equations. It allows time for sharing ideas and provides a printable matching activity...
Math-U-See
Extra Practice
From exponents to slope-intercept form, an array of extra practice exercises will reinforce necessary skills for your middle and high schoolers. The worksheets include practice with order of operations, graphing equations, scientific...
Curated OER
Walk-A-Thon
Students graph linear http://www.lessonplanet.com/review?id=180542equations. In this problem solving lesson, students calculate slope and plot ordered pairs on a coordinate grid. Using a real-life example of a walk-a-thon, students...
Curated OER
Graphing Practice
Click on the download box to access this useful graphing lesson that includes worksheets for homework, assessment, and classroom work. The class graphs basic linear functions. They rewrite the equations from standard form into...
Virginia Department of Education
Transformationally Speaking
Young mathematicians explore transformations of graphs by graphing sets of functions on the same pair of axes. They use their graphs to determine the effect that the values of a and b in y = ax + b have on the graph of y = x.
Curated OER
Algebra 1 Worksheet
In this algebra learning exercise, learners solve equations for y, graph the equations using the slope and y-intercept, and name four points on the line. There are 20 questions with their graphs.
Curated OER
Function-al Machines and Spaghetti Graphs
Sixth graders identify the relationship between patterns and functions. In this algebra lesson, 6th graders use a "Functional Machine" to identify the rule. Students use a function table to plot the points using play dough dots.
Curated OER
2 X 2 Linear Systems
Students solve 2 X 2 systems graphically and algebraically. They investigate parallel systems. They solve application problems using 2 X 2 systems.
Texas A&M University
Wtamu Virtual Math Lab: Intermediate Algebra
This site is a tutorial for students in algebra 2 or for those who need a refresher. The site has explanations, definitions, examples, practice problems and practice tests are found covering topics such as linear equations, graphing,...
University of Colorado
University of Colorado: Ph Et Interactive Simulations: Equation Grapher
An interactive simulation that teaches about graphing, polynomials, and curves by adjusting the constants to observe the effect on the shape of the curve. This simulation can either be downloaded or played online and includes handouts,...
McGraw Hill
Glencoe: Self Check Quizzes 2 Algebraic Equations
Use Glencoe's Math Course 2 randomly generated self-checking quiz to test your knowledge of solving and graphing equations. Each question has a "Hint" link to help. Choose the correct answer for each problem. At the bottom of the page...
Illustrative Mathematics
Illustrative Mathematics: Hsa ced.a.2 Create Equations in Two or More Variables
Choose from a variety of creative problems (tasks) to teach how to create equations in two or more variables to represent relationships between quantities and graph equations on coordinate axes with labels and scales. Explanations and...
Concord Consortium
Seeing Math: Quadratic Transformer
The Quadratic Transformer was developed to support the learning of quadratic functions, and in particular to help you understand the connections between symbolic and graphic representations. Indirectly, it also helps you connect either...
Math.com
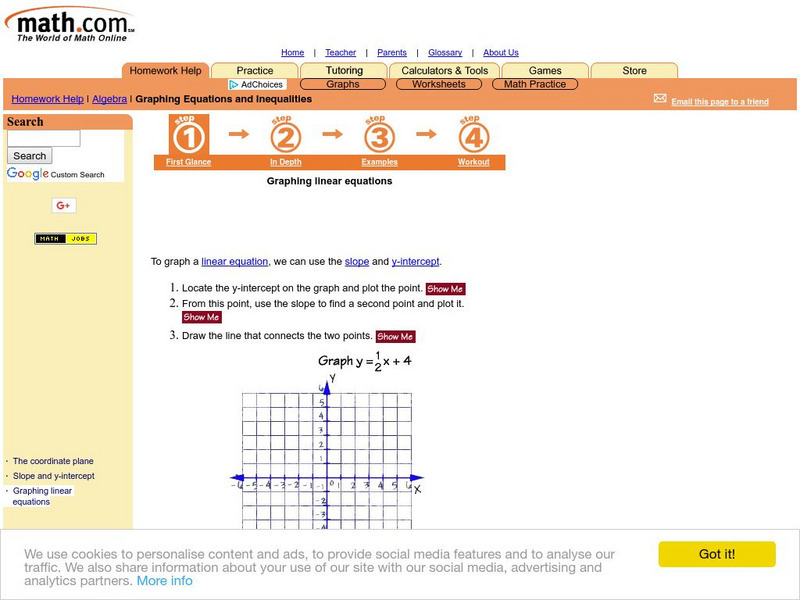
Math.com: Algebra: Graphing Linear Equations
The lesson investigates how to graph linear equations. The tutorial includes definitions, examples, and a worksheet.
Texas Instruments
Texas Instruments: Mc Dougal Littell Middle School Math: Graph Linear Functions
Students will graph the equations and determine if the viewing window is appropriate for the graphs.
Texas Instruments
Texas Instruments: Muddy Footprints Adventure 11
In this adventure, students will analyze the relationship between height and stride length, and then use that information to identify the biker who left the footprints. They create a scatter plot, find the linear regression equation for...
Texas Instruments
Texas Instruments: Inverse of Two Temps
In this activity, students find a conversion equation that will calculate the corresponding Celsius temperature for any given Fahrenheit temperature. Students learn to graph scatter plots, analyze and graph linear equations, compute and...
Texas Instruments
Texas Instruments: Social Security Issues
In this activity, you will look at the relationship between the age at which you start drawing social security and the amount drawn. Both graphs and spreadsheets will be used.
Texas A&M University
Wtamu Virtual Math Lab: Intermediate Algebra: Graphing Equations
Through this tutorial, you will learn how to solve equations by graphing them on a coordinate plane. Contains several examples with step-by-step solutions and practice exercises for you to complete and check.


