Curated OER
Tally and Graph
In this survey and graphing worksheet, students take a survey of 10 friends by asking them to vote for their favorite musical instrument. They fill in a tally chart, track the tally marks, and develop a bar graph with the information.
Curated OER
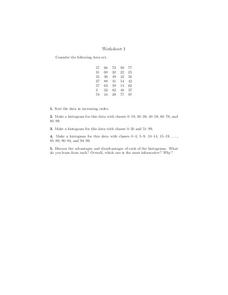
Histograms
In this histograms worksheet, students construct 3 different histograms from the same data set. Students also sort the data and answer 1 discussion question.
Curated OER
Make a Graph
In this graphing learning exercise, 1st graders use given data to create a graph and answer questions. In this problem solving learning exercise, students solve five problems.
Curated OER
Spaghetti Graphs
Learners work in pairs to test the strength of spaghetti strands. They collect and graph data to determine a line of best fit. Students create a linear equation to interpret their data. Based on the data collected, learners predict...
Curated OER
Impact!!
Students perform a science experiment. In this algebra lesson, students collect data from their experiment and create a graph. They analyze the graph and draw conclusion.
Curated OER
Robot Rounding!
Students collect data on a robot and relate the behavior to prove there is an infinite minute set of numbers. In this algebra lesson, students verify that there is always a number between two numbers. They analyze and make inference from...
Curated OER
Can You Make a Hole in One?
Students relate miniature golf to reflection of an image. In this algebra lesson, students collect and graph data as they study linear equations. They apply properties of graphing to solve real life scenarios.
Curated OER
Does Music Cam the Savage Beast?
Students collect, graph and analyze data. For this statistics lesson, students measure the heart beat of a person as they listen to music. They use the CBL and TI to create a graph, analyzing the outcome.
Curated OER
Walking on Air
Pupils collect and analyze data with a graph. In this statistics instructional activity, students use central tendencies to find the meaning of their data. They display the data on a Ti calculator.
Curated OER
How High Are the Clouds?
Learners analyze height and collect data to create a graph. In this statistics lesson, students use central tendencies to analyze their data and make predictions. They apply concept of statistics to other areas of academics to make a...
Curated OER
Graphing Data Brings Understanding
Students collect, graph and analyze data. In this statistics lesson, students use circle, pie, bar and lines to represent data. They analyze the data and make predictions bases on the scatter plots created.
Curated OER
Constant Dimensions
Middle schoolers explore measuring units by investigating the dimensions of different objects. In this data graphing lesson, students utilize candy, beads and fingers to measure different dimensions of geographic figures. Middle...
Curated OER
Make a Line Graph
In this make a line graph learning exercise, 6th graders make a line graph for 2 sets of data, using a blank grid, by plotting the numbers, labeling the x and y axes and writing a title.
Curated OER
Shapes Graphing
In this graphing data worksheet, students examine the 11 shapes pictured and use that information to finish an incomplete bar graph.
Curated OER
Survey Says...
Students practice taking surveys to answer different questions about radio. In this communications lesson, students brainstorm to create questions they can ask strangers about how often they listen to their radio. Students turn the...
Curated OER
My Test Book: Stem and Leaf Plots
In this math skills worksheet, students solve 10 multiple choice math problems regarding stem and leaf plots. Students may view the correct answers.
Curated OER
Too Many Tulips
In this graphing information instructional activity, students read 6 sentences and then fill in the chart with the appropriate information from the sentences.
Curated OER
Fill in the Graphs
In this graphing information activity worksheet, students use the 6 provided clues to appropriately fill in the blanks in a pie chart.
Curated OER
Weather "Whys"
Students explore the weather. In this weather data lesson, students collect weather data from Internet and media sources. Students graph the collected data discuss it as well as the seasons of the year.
Curated OER
Thanksgiving Dinner
Students plan a traditional Thanksgiving dinner. In this Thanksgiving lesson, students compare and contrast the first Thanksgiving to Thanksgiving celebrations today. Students plan a traditional Thanksgiving dinner and research the costs...
Curated OER
French Fry Run
Student explore estimation and measurement. In this measurement lesson, 2nd graders measure french fries, graph their data, and determine the size of french fries that is the best value. Students practice how to add prices and calculate ...
Curated OER
Charting and Graphing Sales
Students analyze graphs, charts and tables. In this data analysis lesson plan, students practice creating and analyzing charts, graphs and tables corresponding to sales and surveys. This lesson plan uses data relevant to students and...
Curated OER
Building Venn Diagrams
Young scholars use Venn diagrams to solve prime number and factorization problems. In this multiplication lesson, students watch a video and use a Venn Diagram to help them solve a pizza math activity that uses prime factorization. Young...
Curated OER
Graphing Data
First graders explore the concept of graphing. In this data lesson, 1st graders gather information from a class survey and display their findings on a picture graph. Students also practice solving problems that their instructor models.


