GeoGebra
GeoGebra Graphing Calculator
So, exactly, what does it look like? The easily usable graphing calculator allows pupils to visualize the graph of equations and inequalities. The interactive supports any algebraic graph needed for high school mathematics and then some.
Ontrack Media
Chart of Parent Functions
The characteristics of parent function vary from graph to graph. Let learners decipher the graph, table of values, equations, and any characteristics of those function families to use as a guide. The nicely organized page...
Los Angeles County Office of Education
California State Standards: Algebra I
Starting a year of Algebra I? This mighty packet practices all of the major topics with different ranges of difficulty. Standards include everything from linear to quadratic to rational expressions. Use it in a...
K20 LEARN
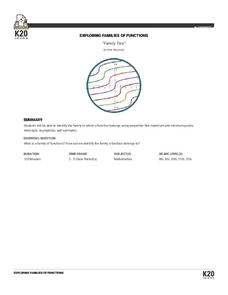
Family Ties: Exploring Families OF Functions
They say it runs in the family. Small groups use a card sorting activity to group graphs of functions into families. After grouping by families, the class develops conclusions for parent functions and create a graphic organizer.
Flipped Math
Transformations of Functions, Pt. 2
Workout with stretches and compressions. Scholars view what happens to the graph when multiplying a function by a number. Learners combine stretches and compressions with translations before practicing the newly learned skill by pausing...
Flipped Math
Transformations of Functions, Pt. 1
It is transformational! With the beginning lesson on transformations, pupils learn about vertical and horizontal translations. Scholars see how to graph important points to show the translations and then to write the transformed graph in...
Flipped Math
Unit 7 Review: Exponential Functions
Take a break from learning new information and take time to review. Scholars review the unit by completing some practice problems. They rewrite expressions using exponents, solve exponential equations, graph exponential functions,...
Flipped Math
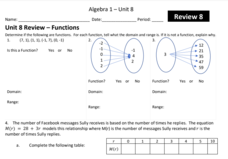
Unit 8 Review: Functions
Let's finish a functional review. Pupils work through 31 items to review the concepts learned in Unit 8. Scholars determine whether a mapping is a function and identify the domain and range. Using function notation, individuals then...
Flipped Math
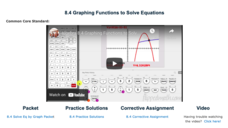
Graphing Functions to Solve Equations
Intersections become solutions. Scholars watch a video on using a graphing calculator to find the solution to an equation in one variable. While watching the presentation, pupils practice working some of the examples and compare their...
Flipped Math
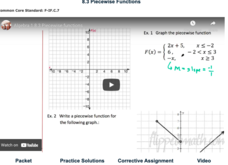
Piecewise Functions
Break it up into pieces to solve the problem. Individuals watch a video on how to graph and determine the equation and values of piecewise functions. Viewers then work several exercises to practice evaluating a piecewise function at...
Flipped Math
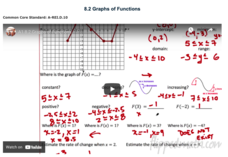
Graphs of Functions
Create a graphical description. Pupils watch a video presentation starting with vocabulary on properties of a graph of a function and then use the vocabulary to find key features of graphs of a function. Scholars use three graphs in the...
Flipped Math
Exponential Decay
The values keep getting smaller—quickly! Pupils watch a video that contrasts exponential decay with exponential growth from the first lesson in the unit. Learners identify exponential functions that are decaying and create graphs of...
Flipped Math
Exponential Growth
They grow by leaps and bounds. Learners watch a quick review on function notation as they prepare to learn more about exponential growth. Using their knowledge from sequences, pupils find out whether a function is linear or exponential,...
Flipped Math
Calculus AB/BC - Sketching Graphs of Functions and Their Derivatives
Find deeper meaning in graphs. Pupils use the knowledge gained from the previous sections in the unit to sketch graphs of a function's derivative. Learners also see how to sketch a graph of a function given the graph of its derivatives....
Flipped Math
Calculus AB/BC - Determining Intervals on Which a Function is Increasing or Decreasing
Going up? Wait, it might be going down! Learners watch a video to see how to use the derivative and critical points to find where a function is either increasing or decreasing. Individuals use the rate of change to solve real-world...
Radford University
Skate Ramp
Going up and down makes a more exciting ride. Pupils recall what they know about continuity and limits of functions. Working in groups, classmates design a skateboard ramp that meets a given set of criteria, using at least three...
Rice University
Algebra and Trigonometry
Move on into trigonometry. An informative eBook takes the content of a College Algebra course and adds more relating to trigonometry and trigonometric functions. The content organization allows pupils to build upon their learning by...
Concord Consortium
Rule of 72
Find an easier way to double it. Using the price of an item and the Consumer Price Index, learners determine how long it will be for the price to double. Scholars calculate the length of time it would take for the price to double using a...
Concord Consortium
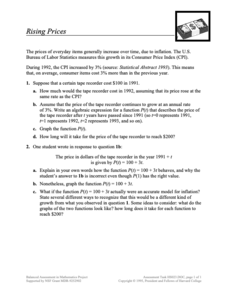
Rising Prices
What will that cost in the future? The scenario provides pupils with a growth as a Consumer Price Index. Learners create functions for a given item to determine future prices and graph them. Class members then compare their functions to...
Concord Consortium
Quadratic Reflections
Reflect upon the graphs of quadratic functions. Given a quadratic function to graph, pupils determine whether the graph after a horizontal and vertical reflection is still a function. The final two questions ask scholars to describe a...
Concord Consortium
Rational and Not So Rational Functions
Do not cross the line while graphing. Provided with several coordinate axes along with asymptotes, pupils determine two functions that will fit the given restrictions. Scholars then determine other geometrical relationships of asymptotes...
Concord Consortium
People and Places
Graph growth in the US. Given population and area data for the United States for a period of 200 years, class members create graphs to interpret the growth over time. Graphs include population, area, population density, and population...
Corbett Maths
Transformations of Graphs
Geometric transformations in algebra ... what? Given four transformations, the narrator explains how each affect the graph of the original function. The transformations involve translations and reflections, both horizontally and...
PHET
Graphing Quadratics
Quadratics only have three terms, but each one is fairly important. Scholars use an interactive to explore how each coefficient affects the graph of a quadratic function. They also see how changes to the vertex form and how changes to...


