GeoGebra
GeoGebra Graphing Calculator
So, exactly, what does it look like? The easily usable graphing calculator allows pupils to visualize the graph of equations and inequalities. The interactive supports any algebraic graph needed for high school mathematics and then some.
Lane Community College
Review Sheets: Beginning Algebra
This jumbo worksheet contains everything you need to get through Pre-Algebra. Begin with simple expressions, and end with linear functions and polygons. There are multiple problems for each topic to make sure those skills are set.
Del Mar College
Algebra Assessment Review
Take the time out of preparing an algebra review and use this multiple-choice assessment to prep for the big test. Some included topics are factoring, FOILing, inequalities, and linear graphs.
Flipped Math
Unit 2 Review: Create and Solve Equations and Inequalities
Start with the basics. Pupils work through a review of the unit on equations and inequalities. Learners begin with solving equations and inequalities with no context, move on to problems that involve a context, and finish with a...
Flipped Math
Solve Inequalities
One solves inequalities just like equations ... well, almost. Pupils watch a video lecture on solving linear inequalities. They practice solving inequalities, check their answers with the video, and continue to practice the concept with...
CCSS Math Activities
Smarter Balanced Sample Items: 6th Grade Math – Claim 4
Develop a model for prep. The resource provides examples of how items reflect modeling and data analysis for Smarter Balanced assessments. Items use on-grade or below-grade content to focus on the modeling aspect. The questions revolve...
Mathed Up!
Inequalities
Develop an understanding of things that are not equal. The video demonstrates three types of questions involving inequalities as a review for the General Certificate of Secondary Education math assessment. Pupils work through the...
CCSS Math Activities
Smarter Balanced Sample Items: High School Math – Target J
Good graphs make solving systems simpler. Pupils answer 18 questions shown in a PowerPoint presentation as part of the Claim 1 Item Slide Show series. By considering these questions, they review the concepts of graphing equations and...
Concord Consortium
Graphical Depictions
Parent functions and their combinations create unique graphical designs. Learners explore these relationships with a progressive approach. Beginning with linear equations and inequalities and progressing to more complex functions,...
Shodor Education Foundation
Linear Inequalities
An interactive lesson helps individuals learn to graph inequalities in two variables. Scholars can adjust the interactive to present the inequalities in standard or slope-intercept form.
Desmos
Desmos Graphing Calculator
They say a graph is worth a thousand points. The interactive allows users to graph a wide variety of functions and equations. Using the included keyboard or typing directly into the list, learners determine the graph of a function....
CK-12 Foundation
Checking Solutions to Inequalities: Apples and Bananas Shopping Excursion
Go bananas over a fun interactive! Learners drag a point on a virtual graph of an inequality to see if it is a solution. This helps determine the possible numbers of apples and bananas a shopper can buy with a given amount of money.
CK-12 Foundation
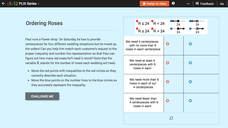
Checking Solutions to Inequalities: Ordering Roses
It's important to have the correct number of flower arrangements at a wedding. Scholars match an inequality and a graph given a situation involving roses for wedding receptions. A set of challenge questions checks the matching pairs.
CK-12 Foundation
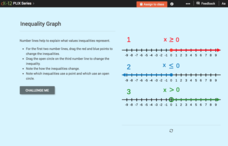
Inequality Expressions: Inequality Graph
Don't let inequalities be a drag. As young mathematicians drag the endpoint of the graph of an inequality in an interactive, the algebraic form of the inequality changes. This helps them see how the graph connects to the inequality.
CK-12 Foundation
Graphs of Systems of Linear Inequalities in Two Variables: President Jefferson's Octagonal Home
Mathematically complete a set of blueprints. Using eight linear inequalities, pupils create a blueprint of Thomas Jefferson's home. Individuals graph the linear inequalities and position the solution of the inequalities before...
Virginia Department of Education
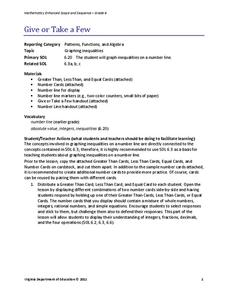
Give or Take a Few
Young mathematicians extend their knowledge of rational numbers on a number line to graph inequalities by first using number cards to compare rational numbers. They finish by using similar reasoning to graph inequalities on a number line.
Virginia Department of Education
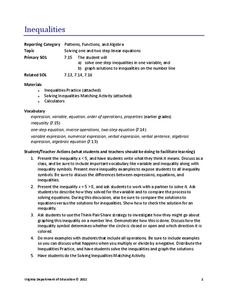
Inequalities
Not all resources are created equal — and your class benefits! Scholars learn how to solve one-step inequalities using inverse operations. They complete an activity matching inequalities to their solutions.
EngageNY
Writing and Graphing Inequalities in Real-World Problems
Inequalities: when one solution just doesn't suffice. Individuals learn to write inequalities in real-world contexts and graph solution sets on the number line. All inequalities in the lesson are of the form x < c or x < c.
Mathematics Vision Project
Equations and Inequalities
Help learners get their facts in line to build and solve complicated linear equations and inequalities. Pupils build upon their knowledge of solving basic equations and inequalities to solve more complex ones. Individuals work with...
EngageNY
Mid-Module Assessment Task: Grade 7 Mathematics Module 3
Lesson 16 in the series of 28 is a mid-module assessment. Learners simplify expressions, write and solve equations, and write and solve inequalities. Most questions begin as word problems adding a critical thinking component to the...
Virginia Department of Education
Solving and Graphing Inequalities
You can't go wrong with a lesson plan that involves candy! Learners solve and graph one-variable inequalities and use candy to graph the solution. Individuals associate open circle graphs with life savers and closed circle graphs with...
Virginia Department of Education
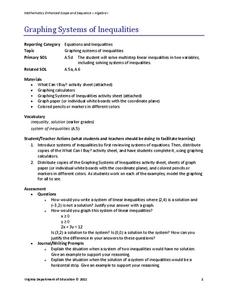
Graphing Systems of Inequalities
Apply systems of inequalities to a real-world problem. Here, scholars learn to graph solutions to systems of linear inequalities. To finish the lesson, they solve a problem involving burgers and cheeseburgers using a system of inequalities.
Mathed Up!
Inequalities Regions
Discover how to solve systems of inequalities by graphing. An informative video shows pupils how to determine the solution set after graphing each inequality of a system. To finish, a worksheet gives them a chance to practice this skill.
Bowland
Problem Page
Future mathematicians use a given graph to answer a question about age differences in relationships. Along the way, they must find the equation and inequality of given graphs.


