Curated OER
Pizza Possibilities
Middle schoolers create and interpret line plots, bar graphs, and circle graphs. The lesson assumes mastery of conversions from fraction to decimal to percent, construction of angles, and at least an introduction to graphs displaying data.
Curated OER
Choose a Graph to Display Data
In this math graphs worksheet, students write line plot, tally chart, pictograph, or bar graph to tell the best kind of graph to use to answer the six questions.
Curated OER
Line Plot Touchdowns
In this line plots worksheet, students read the number of touchdowns that were scored in Super Bowl Games from 1990-2000. Students use the line plots to answer the questions.
Curated OER
Collect and Organize Data - Practice 14.1
In this data collection worksheet, students read the word problem and study the tally chart about favorite sports. Students then use the information in the chart to answer the questions. Students then use the list about students'...
Curated OER
Double Bar Graphs - Practice 7.1
In this double bar graph worksheet, students make a double bar graph from given information, then solve related problems in addition to 2 test prep problems. Houghton Mifflin text referenced.
Curated OER
Counting on Cup
A basic approach to counting on, this math game has beginners partner up and use number cards and dice as they practice beginning addition. One partner chooses a number card and counts that many objects into a cup. The second partner...
Curated OER
Linking Number Patterns and Algebraic Expressions
Examine algebra using digital resources! Budding mathematicians will watch Cyberchase episode segments that propose a problem. Using information gathered from the video, they practice recording number patterns in several different ways:...
Curated OER
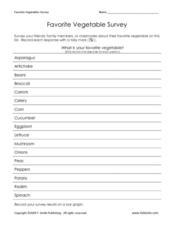
Favorite Vegetable Survey
What's your favorite? Use this chart template in your lesson on data collection and graphing. Learners record classmates' favorite vegetable in a survey, and then graph the results. A labelled graph is provided here- print both pages...
Curated OER
Boomerang
Students explore the concept of boomerangs. For this boomerang lesson, students throw homemade boomerangs at different angles to record maximum distance and if it returned or not. Students collect their boomerang data then create a...
Curated OER
Circle Graphs
In this circle graphs worksheet, learners solve and complete 8 different problems that include word problems referring to two different circle graphs shown. First, they follow the directions for each problem and complete the table that...
Curated OER
Make Your Own
Your first and second graders will categorize hearts, triangles, and stars, putting them in a picture graph. After the shapes are organized, they compare the number of each using the sentence frames provided.
Curated OER
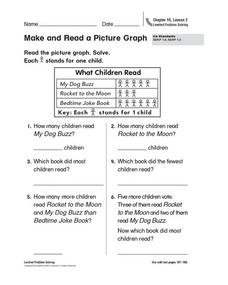
Make and Read a Picture Graph
What books do you like? Have your learners read and interpret a picture graph detailing a fictional class's favorite books. Consider conducting a survey of your learners' favorite books and plotting the results as a class!
Curated OER
Kids/Blocks/Learning
Help develop graphing skills in your young learners.. They create a picture graph, represent 1:1 correspondence, represent same and different, and draw conclusions. They write an experience story about the conclusions drawn from the...
Curated OER
Apple Graphing
Do you like apples? Create a taste test for your first and second grade learners. Cut red, green, and yellow apples, and have learners select their favorite. After tasting all of the apples, they collect data and graph the results with...
Curated OER
Graphing
Intended for a faith-based classroom, this lesson requires second graders to create a survey, conduct the survey in multiple classrooms, and graph the results. They can choose between creating a picture or bar graph, or you can require...
Curated OER
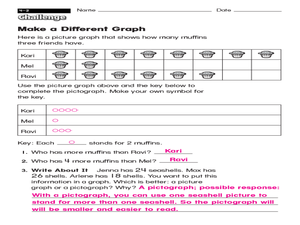
Make a Different Graph
What is the difference between a picture graph and a pictograph? Young learners are given a picture graph detailing how many muffins three friends have, and they must complete a pictograph using a symbol of their choice. An answer key is...
Curated OER
Picture Graphs
Are your youngsters learning how to read picture graphs? Use these five examples to asess your learners' comprehension. Consider rearranging them differently; the presentation is slightly congested.
Curated OER
Read a Picture Graph
It's the Bears vs. the Seals! Who is the season winner? Read this data and have your math class answer the six questions that follow. Consider graphing the chart as a class, or encouraging individuals to graph it before answering the...
Curated OER
Math--Pictures and Bars--Learning About Graphs
What is a graph? What does it tell us? How do you make one? These are all questions that are answered in the included packet. It's a great introduction to graphing for young learners!
Curated OER
Interpreting Data from Birdfeeders
What kinds of birds live in your area? Read a book about birds to your learners and explore their feeding patterns. Charts and graphs are provided in this three page packet, but consider assigning the basic questions if using with young...
Curated OER
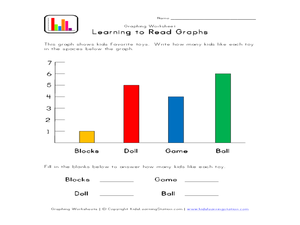
Learning to Read Graphs 2
Do you like playing with blocks, dolls, games, or balls? Use this basic graph to review bar graphs with young learners. After completing the four questions below, consider creating your own class graph: who likes blocks the best? Who...
Curated OER
Learning to Read Graphs
What is your favorite pet? This is a great tool for youngsters just learning how to read and interpret graphs. There are four simple questions. Consider extending this activity by creating a class bar graph: how many learners have a dog,...
Curated OER
Use a Graph Practice 4.8
What do you like to do after school? Study this bar graph and have learners answer the five questions that follow. Consider asking learners to draw their own bar graph for number five (even though the question can be answered without...
Curated OER
Tim and Pat at the Store: Bar Graphs
Do you like candy? Tim and Pat go to the candy store every day after school. Can you use the chart to determine how much money they spend each day? Does one spend more than the other?


