Curated OER
Tossing a Number Cube-- Tally Marks
In this math learning exercise, students investigate probability by tossing a number cube 20 times and recording the times that it lands on each number. Tally marks are used to record data. Students then participate in an experiment in...
Curated OER
How Do You Like To Eat Your Apples?-- Class Bar Graph
In this math worksheet, students collaborate as a group to plot data pertaining to their favorite ways to eat apples: sliced, pie, whole, sauce, caramel or muffin. Students record their class data on the bar graph.
Curated OER
How Do You Like Your Chicken Best?: Graph
In this bar graph worksheet, students will ask classmates, "How do you like your chicken best?" Students can choose nuggets, baked/fried, or sandwich as their favorite chicken entree. Students will record answers to complete the bar graph.
Curated OER
Which Fruit Do You Like To Eat the Most?: Graph
In this favorite fruit bar graph worksheet, students will ask classmates which fruit is their favorite: apples, blueberries, cherries, oranges, strawberries. or watermelon? Then students will record responses to complete the graph.
Curated OER
Which Flavor of Ice Cream Do You Like Best?: Graph
In this favorite ice cream bar graph worksheet, students will ask their classmates which flavor is their favorite: vanilla, chocolate, mint, strawberry or chocolate chip? Then students will record the responses to complete the graph.
Curated OER
Which is Your Favorite Literacy Corner To Visit?: Graph
In this favorite literacy corner bar graph worksheet, students will ask their classmates which center they like the best and record the responses to complete the graph. There are 10 centers from which to choose.
Curated OER
What is Your Favorite Pet?: Graph
In this favorite pet bar graph worksheet, students will ask their classmates which pet is their favorite: fish, dog, turtle, bird, or cat? Then they will record the responses to complete the graph.
Curated OER
Where Do You Like To Eat the Most?: Graph
In this favorite restaurant bar graph worksheet, students will ask their classmates where they prefer to eat. There are 6 fast food restaurants from which to choose. Then students will record responses to complete the graph.
Curated OER
Frog Color Graph
In this bar graph worksheet, students will find different color frogs in the classroom, graph them according to color and return the frogs to the proper location.
Curated OER
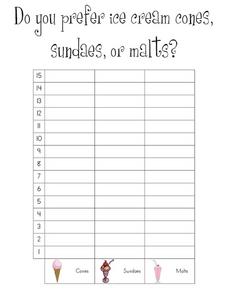
Do You Prefer Ice Cream Cones, Sundaes, Or Malts?: Graph
In this favorite ice cream bar graph worksheet, students will ask their classmates how they prefer their ice cream and record the responses to complete the graph.
Curated OER
Endangered Species
For this geography worksheet, students identify how to manipulate data on a range of endangered species. They create a bar graph of endangered animals from Africa, Asia, Australia, North America, or South America. Students use a...
Curated OER
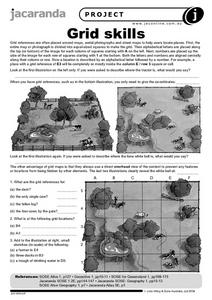
Grid Skills
In this geography activity, students use grid references on a map to locate places in the pictures given. They also identify another advantage of using a grid map, which they have an overhead view of the content to prevent any features...
Curated OER
Favorite Days of the Week
In this bar graph worksheet, students use the blank graph to survey classmates and record their favorite day of the week. Students think of one question about the graph and write it on the line.
Curated OER
Tally Marks
For this mathematical worksheet, students practice mastering the concept of keeping up with tally marks in a variety of activities. Students complete a survey involving tally marks.
Curated OER
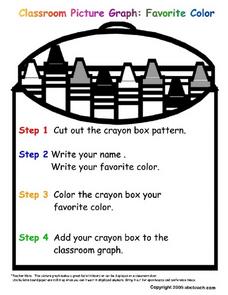
Classroom Picture Graph: Favorite Color
In this picture graph learning exercise, 1st graders will cut out a crayon box pattern and write their name and favorite color on it. Then they will color it their favorite color and add to the classroom graph.
Curated OER
THE EASTER BUNNY GETS READY! PICTURE GRAPH
In this graphing worksheet, students read a picture graph about colors of Easter eggs and then answer questions about the graph.
Curated OER
Going Bananas: Addition and Graphing
In this addition worksheet, 1st graders will look at a picture to add the total number of bananas a monkey eats per day for five daily sums. Then students will answer four short word problems which require students to view the data as a...
Curated OER
Data Analysis and Probability
Students make their own puzzle grid that illustrates the number of sit-ups students in a gym class did in one minute, then they make a histogram for this same data. Then they title their graph and label the scales and axes and graph the...
Curated OER
Shake It Up with Scatterplots
Middle schoolers identify how to use a scatterplot to compare two sets of data to determine if they are related. Then they identify and describe the definition of regression line (the "line of best fit"). Students also identify how...
Curated OER
Responding to A Sound of Thunder by Writing PowerPoint Presentations
Students, after reading "A Sound of Thunder," create a PowerPoint presentation about time travel. They study and utilize a graphic organizer to assist them in preparing to deliver an oral presentation next and finally they print their...
Curated OER
Let's Learn About Firefighters!
Students explore, analyze and study about fire fighters and fire safety. They listen to a book, list what they already know about firefighters and fire safety rules and compare/contrast types of firefighters. Each student then writes a...
Curated OER
Explore Chapters 1 - 5
Students preview the novel, "Dragonwings," by Laurence Yep, make connections between the novel previewed and their prior knowledge, other texts, and the world. They utilize graphic representations including charts, graphs, pictures, and...
Curated OER
Math: Graphs and Their Symbols
Second graders examine different types of graphs and discover the meanings of the symbols used on them. After gathering data about themselves, their communities, and the world, they use that information to create graphs. Among the...
Curated OER
Handling Data
Students create a simple table in order to solve a problem. As a class, they create a simple data table in order to discover the number of letters in each student's name. This data is interpreted in order to answer questions and make...


