Curated OER
Grade 5 Social Studies Booklet 1
In this grade 5 social studies booklet 1 worksheet, 5th graders answer 35 multiple choice questions and 10 short answer question in standardized test format.
Curated OER
Count on Math
Learners develop number sense up to a million. In this developing number sense up to a million instructional activity, students count their breaths in given time span. Learners use blocks representing 10's and 100's to create...
Curated OER
My Test Book: Tally Charts
In this online interactive math learning exercise, students solve 10 problems that require them to read and interpret tally chart data. Students may submit their answers to be scored.
Curated OER
Graph a Panther's Diet
Students examine the diet of panthers. In this interpreting data lesson, students collect data on the panther's diet and chart the data in bar and pie graphs.
Curated OER
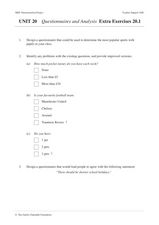
Unit 20 Questionnaires and Analysis Extra Exercises 20.1
In this statistics worksheet, students design a biased questionnaire. They create data displays based on given statistics. There are a total of 9 problems.
Curated OER
Skittles, Taste the Rainbow
Fifth graders learn and then demonstrate their knowledge of a bar and a circle graph using the classroom data. Students are given a pack of skittles candy. Students create a bar and circle graph indicating the results of the contents of...
Curated OER
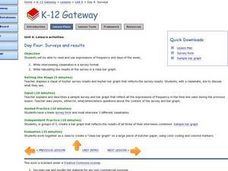
Day Four: Surveys and results
Students use expressions of frequency in the English language. In this ELL lesson, student survey their classmates and turn the information into a class bar graph.
Curated OER
Graphing Conversation Hearts
Students collect data and create a graph. In this mathematics lesson, students separate paper hearts by color and create a graph showing the number of hearts of each color present. Students receive a handful of candy hearts that...
Curated OER
Designing the Toy Planet Store
Sixth graders create a grid of their fictitious store. In this measurement lesson, 6th graders use a computer to measure out the floor of their store and create furniture, doorways, windows, and more. This lesson includes directions for...
Curated OER
Population and Population Density
Students read and interpret graphs. In this population lesson plan, students explore population and population density as they read several data graphs and respond to questions.
Curated OER
Months of the Year
Students practice interviewing. In this months of the year lesson, students interview at least five adults working in their school to gather data on when their birthdays occur. Students create a master calendar for the school.
Curated OER
Shopping With a Circle Graph
In this shopping with a circle graph worksheet, students use the data in the graph to answer 8 questions about the money they have and how they can spend it.
Curated OER
Math for Fourth Grade: Statistical Charts
In this math for fourth grade statistical charts worksheet, 4th graders answer 7 multiple choice questions in standardized test format about data, charts and graphs.
Curated OER
Data and charts
In this data and charts learning exercise, students answer multiple choice questions referring to different charts about mountain heights, breakfast drinks, and more. Students complete 10 multiple choice questions.
Curated OER
My Test Book: Reading Graphs
In this online interactive math skills activity, students solve 10 multiple choice math problems that require them to read and interpret graphs. Students may view the correct answers.
Curated OER
My Test Book: Reading Graphs
In this online interactive math skills learning exercise, students solve 10 multiple choice math problems that require them to read and interpret graphs. Students may view the correct answers.
Curated OER
My Test Book: Reading Pie Charts
In this math skills worksheet, students solve 9 multiple choice math problems that require them to read and interpret charts. Students may view the correct answers.
Curated OER
My Test Book: Stem and Leaf Plots
In this math skills worksheet, students solve 10 multiple choice math problems regarding stem and leaf plots. Students may view the correct answers.
Curated OER
My Test Book: Stem and Leaf Plots
In this math skills instructional activity, students solve 10 multiple choice math problems which require they interpret a stem and leaf plot. Students may view the correct answers.
Curated OER
Charts and Graphs
In this charts and graphs activity, students refer to charts and graphs to solve word problems. Students complete 10 multiple choice word problems.
Curated OER
Bar Graphs
In this bar graph worksheet, students complete math problems having to do with different bar graphs. Students complete 10 problems for 10 different graphs.
Curated OER
Mean, Mode and Bar Graphs
In this mean, mode and bar graphs worksheet, 5th graders analyze the data given, then answer three questions about a bar graph and the data shown.
Curated OER
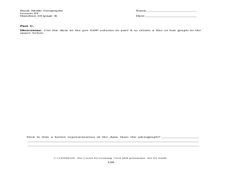
Bar Graph
In this bar graph learning exercise, students answer short answer questions about a bar graph of student's favorite sandwich fillings. Students complete 5 questions.
Curated OER
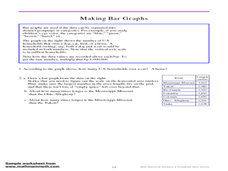
Making Bar Graphs
In this bar graph worksheet, students answer short answer questions about bar graphs. Students answer 1 question about a bar graph about a cat, and 3 questions about a bar graph about U.S. rivers.


