Curated OER
Circle Graphs
Sixth graders interpret, create, and display data in a circle graph. In this circle graph lesson plan, 6th graders use a compass, protractors, pizza boxes, and more to create a circle graph and analyze the data they put into it.
Curated OER
Sorting and Graphing Animals
Students inquire about animals using SIRS Discoverer or eLibrary Elementary. In this organizing data lesson, students sort pictures of animals in various ways and develop graphs. Students locate a mammal, reptile, fish, insect or bird...
Curated OER
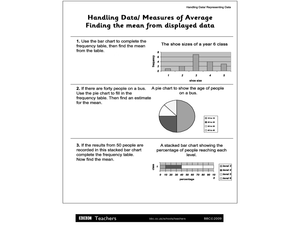
Handling Data/Measures of Average - Finding the Mean from Displayed Data
In this mean and average worksheet, students use the bars and charts to help them find the means using the given data. Students solve 3 problems.
Curated OER
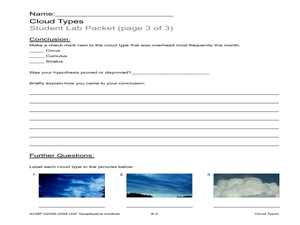
Cloud Types
Students examine cloud types. In this cloud lesson, students identify cloud types, observe clouds and collect data, and analyze data to identify the most common cloud they observe overhead during the course of a month.
Curated OER
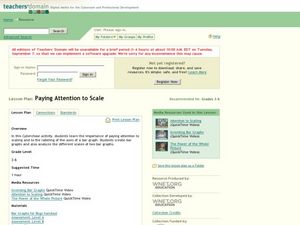
Paying Attention to Scale
Students create bar graphs. In this graphing lesson, students watch video clips about bar graphs and complete worksheets. The focus of this lesson is on creating the correct scale for the bar graph and correctly labeling the axes.
Alabama Learning Exchange
The State Capital of Stem and Leaf
Students explore the concept of stem and leaf plots. In this stem and leaf plots lesson plan, students plot the 50 US states' capitals on a stem and leaf plot according to the first letter of each state. Students compare their stem and...
Curated OER
A Planet Full of Animals
Students study animals and practice classifying them through observation activities. In this animal classification lesson, students complete a KWL chart about animals. Students then sort pictures of animals into chart categories based on...
Curated OER
Savings Planning Using Tables, Line Graphs and Early Proportionality
Students use proportional reasoning to make a chart of daily savings transactions and balances. In this accounting lesson, students read word problems and complete three handouts about a bidding and accounting problem. Students finish...
Curated OER
Diagnosing Allergies Through Data Collection
Students research and organize information about allergies. In this data collection lesson, students watch a video about allergies. Students create a histogram using the information collected. Students complete the 'Displaying Survey...
Curated OER
My Peanut Butter is Better Than Yours!
Students explore the concept of statistical data. In this statistical data lesson, students read an article about the dangers of peanut butter to those who are allergic. Students perform a taste test of two different brands of peanut...
Curated OER
Line of Best Fit
Students explore the concept of linear regression. In this linear regression lesson, students do a Barbie bungee activity where they collect linear data. Students plot their data using a scatter plot. Students determine a line of best...
Curated OER
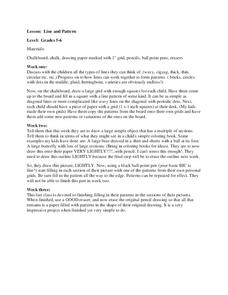
Line and Pattern
Students investigate lines and patterns. In this line and pattern instructional activity, students discuss types of lines and work on grids. They draw a picture very lightly before filling it in with the pattern they made in the grid.
Curated OER
Grasping Graphs
In this grasping graphs worksheet, students solve and complete 3 different types of problems. First, they graph the data described and select the appropriate graph type. Then, students identify the independent and dependent variable. In...
Curated OER
Wordle It
Young scholars discuss, define, and give themselves character traits. In this character traits lesson plan, students create a list of ten character traits that describe themselves. Young scholars create a data table and poll their...
Curated OER
Lesson Plan for Science Class: Journaling
Learners complete science journals to learn about the science process using a fern as study material. In this science journal lesson, students research the resurrection fern. Learners observe the fern in dry and moist conditions and...
Curated OER
Critter Encounter Chart
Students record data found at an assigned web site. In this data collection lesson, students access an assigned web site in order to complete a data chart about animals they see. They travel to different sections of the web site to find...
Curated OER
Graph Groups
In this graphing learning exercise, 3rd graders create their own bar graphs. students study the pictures shown and complete 5 graphs beside each picture.
Curated OER
Use Information in Line, Bar, Circle, and Picture Graphs to Make Comparisons and Predictions
Eighth graders explore the concept of graphs. In this graphs lesson, 8th graders compare and contrast picture graphs, bar graphs, line graphs, and circle graphs. Students examine each type of graph and answer questions and make...
Curated OER
Graph Groups (One Color)
In this graphing worksheet, students solve 5 problems in which the colored shapes in each set are counted. Students then fill out a bar graph to show how many of each color are in the sets.
Curated OER
Graphing Data
First graders explore the concept of graphing. In this data lesson, 1st graders gather information from a class survey and display their findings on a picture graph. Students also practice solving problems that their instructor models.
Curated OER
Bird Feeding and Migration Observation
Students research bird migration and build a bird house. In this bird lesson plan, students research the birds in their area and where they migrate to. They also build their own bird house and record data on what kinds of birds come to...
Curated OER
Graphing Data
First graders learn how to display data using a bar graph. In this bar graph lesson, 1st graders use data from a t-shirt color survey to make a bar graph. They also make an animal bar graph before interpreting the information.
Curated OER
Data Handling: Tally Chart on Illnesses
In this tally chart worksheet, students analyze a chart showing childhood illness cases. Students use the tally chart to solve 6 problems.
Curated OER
Tally Chart: Favorite Names
In this data display worksheet, students analyze a tally chart of favorite hamster names. Using the information on the chart, students solve 8 word problems.


