Curated OER
Santa's List Sums (G2)
In this Christmas math worksheet, students help Santa know the number of children on the given streets in the chart. Students find the sum of the boys and girls for the 17 problems.
Curated OER
Grids
In this geometry worksheet, students plot and label 8 sets of points and triangles on a grid using coordinate pairs. They use both positive and negative numbers.
Curated OER
Maps and Lines
In these organizing data worksheets, 5th graders complete four worksheets of activities that help them learn maps, graphs, and lines. Students then study images of maps, lines, and graphs.
Curated OER
Insects: Grasshoppers
Students examine grasshoppers as they practice following instructions. In this biology lesson plan, students identify the characteristics of grasshoppers and the functions of grasshoppers' external body parts.
Curated OER
Problem Solving 1
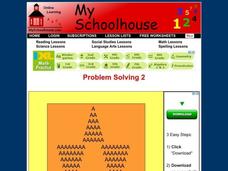
In this online interactive problem solving worksheet, students examine a diagram and use their problem solving skills in order to respond to 5 questions.
Curated OER
Problem Solving 1
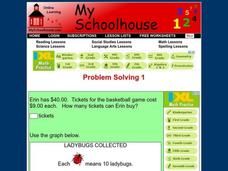
In this online interactive problem solving worksheet, students read a graph and use their problem solving skills in order to respond to 10 questions.
Curated OER
Bar Graph- Calories In Fast Food Items
In this bar graph learning exercise, students analyze a bar graph that shows calories in 10 fast food menu items. Students answer 7 questions about the graph.
Curated OER
Reading Bar Graphs: My Favorite Subject
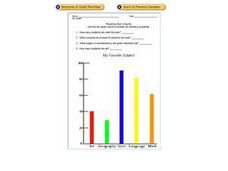
In this bar graphs worksheet, students analyze a bar graph about favorite school subjects. Students use the information on the graph to answer 7 questions.
Curated OER
Tenths
In this fractions and decimals instructional activity, students analyze a data table about painting playground fence posts. Students solve 6 story problems in which a fraction and a decimal are converted.
Curated OER
Gingerbread Man Math
Students collect and explore gingerbread man data. In this math and technology lesson plan, students examine how to organize and interpret data in three formats: objects, pictures, and graphs.
Curated OER
Favorite And Least Favorite Vegetable Survey and Bar Graph
In this favorite and least favorite vegetable survey, students create a bar graph after they survey and keep track of data on this graphic organizer.
Curated OER
Professor Panda's Pizza Graph
In this data analysis worksheet, students answer 11 questions using a bar graph that was constructed from the answers to a survey about pizza toppings. They use a secret code to determine the best place to have a pizza.
Fuel the Brain
Interpret Pictographs
Have your youngsters use a graphic organizer and key to solve the following questions. By learning to interpret the pictographs, they will solve the problems accurately.
Curated OER
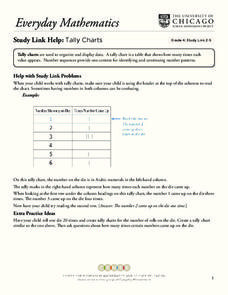
Tally Charts
In this tally charts learning exercise, students discuss how to use a tally chart and how to read the chart. Once students record information on a tally chart they answer questions showing their ability to read a tally chart.
Curated OER
Life Expectancy at Birth
Students create a line graph on the life expectancy for males and females in Canada. In this math and health lesson plan, students review table and graph terminology, create line graphs, and analyze the differences in life expectancy...
Curated OER
Graphing in the Information Age
Learners create a variety of graphs based on population data. For this statistics lesson, students use data that can be gathered on-line to make a bar chart, line graph, and circle graph.


