Curated OER
Timed Multiplication Test Graphs
Students use the tools of data analysis for managing information. They solve problems by generating, collecting, organizing, displaying histograms on bar graphs, circle graphs, line graphs, pictographs and charts. Students determine...
Curated OER
Surveying During a Basketball Game
Tenth graders conduct a survey at a high school basketball game. They compile and present the data as histograms or bar graphs.
McGraw Hill
Glencoe: Self Check Quizzes 2 Using Bar Graphs and Histograms
Use Glencoe's Math Course 2 randomly generated self-checking quiz to test your knowledge of Bar Graphs and Histograms. Each question has a "Hint" link to help. Choose the correct answer for each problem. At the bottom of the page click...
Scholastic
Scholastic: Shake, Rattle & Roll
Students will learn and reinforce skills for creating and analyzing scatterplots and histograms; using cost-benefit analysis to make predictions from data and using tree diagrams to understand outcomes of events.
BSCS Science Learning
Bscs: Budburst Fall Colors
In this Inquiry, students engage in a debate between two characters about when a bed-and-breakfast (B&B) should have a fall leaf-peeping special to maximize the guest experience. Students are introduced to Budburst, a citizen science...
BSCS Science Learning
Bscs: Globe at Night Dark Skies
In this inquiry, students predict the best place to stargaze in Arizona based on the brightness of the night sky. Students are introduced to the concept of light pollution and Globe at Night, a global citizen science project in which...
BSCS Science Learning
Bscs: Frog Symphony
This inquiry focuses on analyzing spatial and temporal data for frog calls to determine the best time of day and location to hear a symphony of frogs. Click on the link for teaching guides and handouts.
BSCS Science Learning
Bscs: Globe at Night Dark Skies
For this inquiry, students predict the best place to stargaze in Arizona based on the brightness of the night sky. Students are introduced to the concept of light pollution and Globe at Night, a global citizen science project in which...
Wolfram Research
Wolfram Math World: Histogram
This MathWorld site offers a clear definition and examples of a histogram.
Texas Instruments
Texas Instruments: Cannibal Critters and Cannibal Critters Cont.
Students will explore probability and statistics using predictions and histograms. Theoretical and experimental probability will also be examined.
Texas Instruments
Texas Instruments: Selection Direction
In this activity you will produce histograms using the Data Graphs Wizard and learn about the concept of biological variance.
Texas Instruments
Texas Instruments: Now You See It, Now You Don't
In this activity, students study the relationship between age and near point accommodation (NPA). They predict a person's age using NPA distance values. They use exponential regression, create box-and-whisker plots and histograms.
Texas Instruments
Texas Instruments: Reaction Time
The students will do experiments involving reaction time, and then make a histogram displaying their data.
Texas Instruments
Texas Instruments: Comparing Distributions of Univariate Data
Students compare univariate data distributions using statistical concepts like box plots, stem plots, and histograms.
Texas Instruments
Texas Instruments: Measure Up
In this activity, students compare their height with the average height of students in the class. They create histograms to analyze the data, and construct box plots to summarize the height statistics.
Stefan Warner and Steven R. Costenoble
Finite Mathematics & Applied Calculus: Continuous Random Variables and Histograms
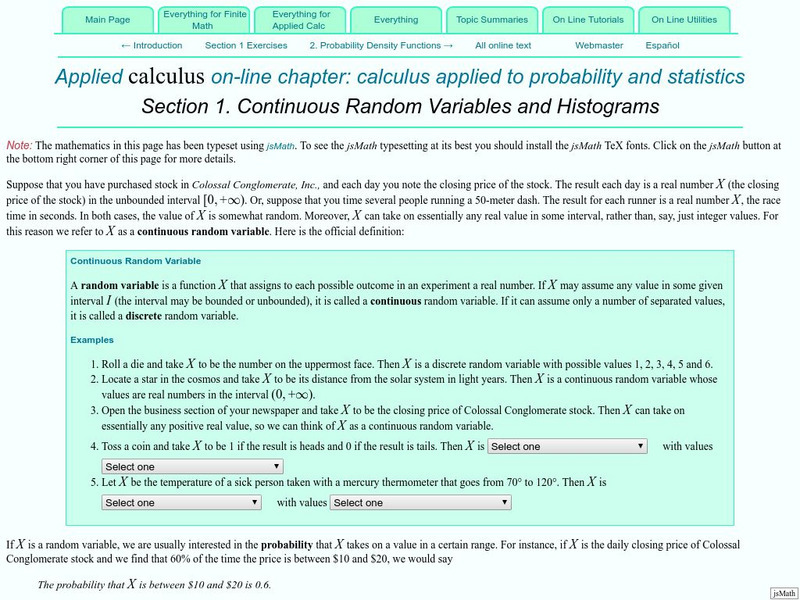
Students learn about random variables and histograms. Topics explored are continuous random variables, discrete random variables, probability, and frequency distributions. The tutorial investigtes the statistics concepts through class...
Math Is Fun
Math Is Fun: Histograms
Explains, with examples, what a histogram is, how it differs from a bar graph, and how to interpret one. Includes a set of practice questions.
Palomar Community College District
Palomar College: Behavioral Science Statistics: Frequency Histogram an Example
A step-by-step worked problem demonstrating how to take a set of data and produce a frequency histogram. Hints are provided along the way and the final graph is shown for the user to check.
Science Education Resource Center at Carleton College
Serc: Histogram Sorting Using Cooperative Learning
Students work with 24 histograms representing distributions with differing shapes and characteristics. By sorting the histograms into piles that seem to go together, and by describing those piles, students develop awareness of the...
CK-12 Foundation
Ck 12: Statistics: Histograms Grades 11 12
[Free Registration/Login may be required to access all resource tools.] This Concept covers making frequency tables and using them to create a histogram.
CK-12 Foundation
Ck 12: Statistics: Histograms Grade 7
[Free Registration/Login may be required to access all resource tools.] Make a histogram given a frequency table.
CK-12 Foundation
Ck 12: Statistics: Stem and Leaf Plots Grades 8 9
[Free Registration/Login may be required to access all resource tools.] Learn how to create stem-and-leaf plots and histograms in order to analyze data.
Khan Academy
Khan Academy: Create Histograms
Practice creating histograms. Students receive immediate feedback and have the opportunity to try questions repeatedly, watch a video or receive hints.
Khan Academy
Khan Academy: Reading Histograms
In this exercise, students practice reading histograms. Students receive immediate feedback and have the opportunity to get hints and try questions repeatedly.


