Willow Tree
Extremes, Range, and Quartiles
The middle of the data is important, but what about the rest of it? The lesson shows learners the importance of the range, quartiles, and extreme values. Pupils practice finding each of these values from given data sets.
EngageNY
Mid-Module Assessment Task - Algebra 1 (module 2)
A mid-module assessment uses two multi-part questions to measure progress toward mastery on descriptive statistics standards. Each part of a question addresses a single standard to help determine mastery.
EngageNY
Measuring Variability for Skewed Distributions (Interquartile Range)
Should the standard deviation be used for all distributions? Pupils know that the median is a better description of the center for skewed distributions; therefore, they will need a variability measure about the median for those...
EngageNY
Comparing Distributions
Data distributions can be compared in terms of center, variability, and shape. Two exploratory challenges present data in two different displays to compare. The displays of histograms and box plots require different comparisons based...
Curated OER
Describing Data
Your learners will practice many ways of describing data using coordinate algebra in this unit written to address many Common Core State Standards. Simple examples of different ways to organize data are shared and then practice problems...
Georgia Department of Education
Math Class
Young analysts use real (provided) data from a class's test scores to practice using statistical tools. Not only do learners calculate measures of center and spread (including mean, median, deviation, and IQ range), but also use this...
Curated OER
Leveled Problem Solving: Range and Outliers
In this range and outliers worksheet, students solve 6 word problems where they examine data then identify outliers, find the upper and lower quartile ranges, find the interquartile range and create box-and-whisker plots.
Mathed Up!
Cumulative Frequency and Box Plots
Learn how to display data. Young data analysts watch a video to review how to create cumulative frequency histograms and box plots. They work on a set of questions to practice producing these data displays.
Curated OER
Data Analysis
In this data analysis worksheet, learners solve and complete 6 different problems that include using various types of data analysis. First, they create a stem-and-leaf plot of the ratios shown at the top and determine the mean, median,...
Curated OER
Measures of Central Tendency
For this measures of central tendency worksheet, students solve and complete 6 different problems. First, they count the number of items in each set of data. Then, students determine the mean, median and mode for each. In addition, they...
Curated OER
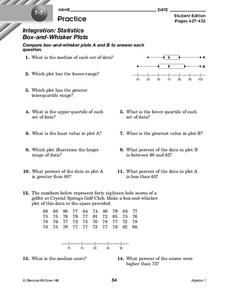
Box-and-Whisker Plots
In this box-and-whisker plots worksheet, 9th graders solve and complete 14 different problems that include comparing various box-and-whisker plots. First, they determine the median for each set of data and plot the lesser range. Then,...
Curated OER
Using Matrices for Data
For this matrices for data worksheet, 9th graders solve and complete 29 various types of problems that include using matrices to illustrate data. First, they determine the sum, difference and scalar product for each matrices shown. Then,...
Curated OER
Statistics
In this statistics worksheet, 8th graders solve and complete 10 different problems that include the measures of variation in statistics. First, they determine the range, median, upper and lower quartiles, and interquartile range for each...
McGraw Hill
Glencoe: Self Check Quizzes 2 Box and Whisker Plots
Use Glencoe's Math Course 2 randomly generated self-checking quiz to test your knowledge of Box-and-Whisker Plots. Each question has a "Hint" link to help. Choose the correct answer for each problem. At the bottom of the page click the...
Cuemath
Cuemath: How to Find Interquartile Range
A comprehensive guide for exploring the topic of interquartile range by finding answers to questions like what is meant by interquartile range, how to find interquartile range, and what is the formula for interquartile range. Includes...
Cuemath
Cuemath: Outlier
A comprehensive guide for exploring the topic of outliers with definitions, what is an outlier, how to find outliers using the turkey method and the interquartile range, solved examples, and interactive questions.
University of Georgia
University of Georgia: Measures of Variation
Lesson plan introduces and explains how to calculate measures of variation concepts such as range and quartile.
Texas Instruments
Texas Instruments: Numb3 Rs: "Take Out" Outliers
Based off of the hit television show NUMB3RS, this lesson has students create box-and-whisker plots for given data, and then determine which (if any) data points are outliers. Students determine outliers through two methods in this...
Other
Online Statistics Education: Measures of Variability
Learning Objectives cover the areas of the Measures of Variability. Explanations are given for: variability, range, interquartile range, variance, and standard deviation. Examples and quizzes are also provided.
McGraw Hill
Mc Graw Hill Education: Glencoe: Measures of Variation
Lesson examples that review how to calculate measures of variation such as range and outliers.
Mangahigh
Mangahigh: Data: Find the Quartiles and Interquartile Range
This site provides students practice with the concept of interquartile range. Students can learn about the topic by completing an interactive tutorial. Students can then take a ten question timed test to practice the skill.
Khan Academy
Khan Academy: Interquartile Range (Iqr)
Practice calculating the interquartile range from a set of data. Students are able to check their answers, view a solution, and watch a video or use a hint.
Math Is Fun
Math Is Fun: Quartiles
Explains what quartiles are and some different contexts in which they are used. Includes ten practice questions.
Khan Academy
Khan Academy: Interquartile Range (Iqr)
Practice finding the interquartile range (IQR) of a data set. Students receive immediate feedback and have the opportunity to try questions repeatedly, watch a video or receive hints.


